doi: 10.56294/ere202218
ORIGINAL
Improvement of municipal income and quality of life through solid waste characterization in El Distrito, Villa El Salvador
Mejora de ingresos económicos municipales y calidad de vida por caracterización de residuos sólidos en El Distrito, Villa El Salvador
Miguel Ángel Melgarejo Quijandria1
1Universidad Nacional Agraria La Molina, Escuela de Posgrado, Maestría en Administración. Lima, Perú.
Cite as: Melgarejo Quijandria MA. Improvement of municipal income and quality of life through solid waste characterization in El Distrito, Villa El Salvador. Environmental Research and Ecotoxicity. 2022; 1:18. https://doi.org/10.56294/ere202218
Submitted: 22-04-2022 Revised: 09-07-2022 Accepted: 12-05-2022 Published: 13-05-2022
Editor: Prof.
Dr. William Castillo-González ![]()
ABSTRACT
The municipalities count on ordinary income, which are those coming from the administration of their patrimony, including the rates by the use of the goods and services; administrative fees for licenses or authorizations. Here it is good to establish a reflection, since there is a technical inaccuracy in terms of the term “rates”, because the meanings of rates are confused with “prices”, which have a differentiation in the legal, economic and tax fields, because the rates they involve the consideration for a service and give rise to taxes; while the use or lease of municipal goods, for example, by way of concession as a management mode, do not generate rates but prices. The solid waste characterization study is a management tool that emerges from a coordinated and concerted process between authorities and municipal officials, representatives of local, public and private institutions, promoting proper management and management of solid waste, ensuring efficiency, efficiency and sustainability, from its generation to its final disposal, including minimization processes: reduction, reuse and recycling of solid waste where formalized recyclers are included. This research seeks to improve the management of household and non-residential solid waste through the application of strategic management tools that will diagnose, plan and design a series of strategic guidelines that will be part of the Improvement Proposal for the collection of income. Municipal. Source Segregation Program and Selective Collection of Residential Solid Waste in the Villa el Salvador district. Regarding the strengthening of the Management of the SEGAVE (Environmental Management Service of the Municipality of Villa El Salvador), the development of regulatory instruments and local management for the solid waste sector through the training of officials and operational personnel in aspects administrative and technical. It also proposes the design and implementation of plans to strengthen the tariff system and monitoring and monitoring mechanisms of the public cleaning service with the acquisition of equipment for monitoring vehicles, the preparation of technical-operational manuals of all stages of the integral management of municipal solid waste and the design of the awareness program for the neighbor of the district of Villa el Salvador. In order to promote appropriate practices for the population, the project proposes the implementation of programs to disseminate norms, municipal regulations and awareness for the timely payment of the service and good solid waste management practices, reuse, among others. The characterization study responds to the determination of the main qualities and characteristics of solid waste, basically consists of a determination, based on percentages of the main elements that constitute it to establish the quantities and variations thereof over time, besides the estimation of some of its physical properties (humidity, density, etc.). The important thing about a characterization is that it is a method that allows to know the composition of residential and commercial solid residues of the district and this knowledge will allow to design a better integral management, achieving at the same time an optimization of the available resources for such effects. In conclusion, this study seeks to generate qualitative and quantitative information, using statistical sampling methods and indicated analyzes, to determine the generation per capita, volumetric weight, humidity, density and the percentage of recoverable and non- recoverable products, in order to substantiate the conclusions and necessary adjustments for the establishment of alternative solutions on the management and elimination of waste and the improvement of the quality of life of the citizen in the district of Villa El Salvador.
Keywords: Solid Waste (S.W.); Quality of Life (Q.L.); Municipal Income (M.I.).
RESUMEN
Los municipios cuentan con ingresos ordinarios, que son los procedentes de la administración de su patrimonio, incluidos las tasas por el uso de los bienes y servicios; las tasas administrativas por licencias o autorizaciones y unas de sus metas es el cumplimiento de diversos parámetros regidos por el ministerio del medio ambiente para lograr la meta municipal anual por la cual se percibirá de un presupuesto participativo el cual será el punto de apoyo principal para todos los proyectos medioambientales que se pretenden realizar en el distrito de Villa el Salvador. El Estudio de caracterización de residuos sólidos es un instrumento de gestión que surge de un proceso coordinado y concertado entre autoridades y funcionarios municipales, representantes de instituciones locales, públicas y privadas, promoviendo una adecuada gestión y manejo de los residuos sólidos, asegurando eficacia, eficiencia y sostenibilidad, desde su generación hasta su disposición final, incluyendo procesos de minimización: reducción, reutilización y reciclaje de residuos sólidos en donde se incluya a recicladores formalizados. La presente investigación busca mejorar la gestión de los residuos sólidos domiciliarios y no domiciliarios a través de la aplicación de herramientas de gestión estratégica que permitirán diagnosticar, planificar y diseñar una serie de lineamientos estratégicos que formarán parte de la Propuesta de Mejora para la recolección de Rentas Municipales. Aplicación de una alternativa para el mejoramiento de la calidad de vida en los vecinos del distrito, un Programa de Segregación en la Fuente y Recolección Selectiva de Residuos Sólidos Domiciliarios en el distrito de Villa el Salvador. En cuanto al fortalecimiento de la Gestión del SEGAVE (Servicio de Gestión Ambiental del Municipio de Villa el Salvador) , el desarrollo de instrumentos normativos y de gestión local para el sector de residuos sólidos a través de la capacitación de funcionarios y del personal operativo en aspectos administrativos y técnicos. Asimismo se propone el diseño e implementación de planes de fortalecimiento del sistema tarifario y de mecanismos de supervisión y monitoreo del servicio de limpieza pública con la adquisición de equipos para el monitoreo de los vehículos, la elaboración de manuales técnicos-operativos de todas las etapas de la gestión integral de residuos sólidos municipales y el diseño del programa de sensibilización al vecino del distrito de Villa el Salvador. Para promover adecuadas prácticas de la población el proyecto propone la implementación de programas de difusión de normas, disposiciones municipales y la sensibilización para el pago oportuno del servicio y buenas prácticas de manejo de residuos sólidos, reaprovechamiento, mejora de la calidad de vida del vecino entre otros. El estudio de caracterización responde a la determinación de las principales cualidades y características de los residuos sólidos, básicamente consiste en una determinación, en base a porcentajes de los principales elementos que lo constituyen para establecer las cantidades y variaciones de las mismas a través del tiempo, además de la estimación de algunas de sus propiedades físicas (humedad, densidad, etc.). Lo importante de una caracterización es que se trata de un método que permite conocer la composición de los residuos sólidos domiciliarios y comerciales del distrito y este conocimiento permitirá diseñar una mejor gestión integral, logrando a su vez una optimización de los recursos disponibles y a través de los análisis respectivos la aplicación de una solución para el mejoramiento de la calidad de vida del vecino de Villa el salvador. En Conclusión este estudio busca generar información cualitativa y cuantitativa, utilizando métodos de muestreo estadístico y análisis señalados, para la determinación de la generación per cápita, peso volumétrico humedad, densidad y el porcentaje de productos recuperables y no recuperables, con la finalidad de fundamentar las conclusiones y adecuaciones necesarias para el establecimiento de alternativas de solución sobre el manejo y eliminación de desechos y el mejoramiento de la calidad de vida del ciudadano en el distrito de Villa el Salvador.
Palabras clave: Residuos Sólidos (R.S.); Calidad de Vida (C.V.); Rentas Municipales (R.M.).
INTRODUCTION
Solid waste management in Peru has been carried out based on immediate response to the services demanded by the population, without considering long- and medium-term planning and inter-institutional synergies in most cities, despite national regulations for this purpose. A starting point for planning the management and operation of solid waste services at the municipal level is a study to characterize solid waste under the jurisdiction of local governments, as this study is used to define plans for improving or expanding municipal services and determining the size of solid waste infrastructure, with the consequent allocation of resources for its implementation (personnel, time, frequency, machinery, etc.).(1,2,3,4)
Municipal solid waste characterization studies (ECRS) are generally considered a technical tool because they provide specific information on the generation, density, and composition of solid waste, among other parameters that can be determined (moisture, field capacity, etc.). However, it is a management tool that allows for the projection of the parameters above and, therefore, medium- and long-term planning for solid waste management. For this reason, this characterization study aims to provide a management tool that allows for decision-making based on knowledge of the parameters related to the generation and management of municipal solid waste.(5,6,7,8)
Villa el Salvador is no stranger to this problem, which is why the district municipality of that commune carries out technical studies on solid waste, such as the Municipal Solid Waste Characterization Study, a fundamental input for the design of collection and final disposal systems in the short, medium, and long term.(9,10,11,12)
All of this aims to substantially improve the quality of life of the residents of the district of Villa el Salvador. Through these results, we will be able to implement various projects for its development (purchase of compactors, hiring of personnel, training in general, etc.). We will also be able to manage the district's revenues adequately through the granting of clear licenses by category and the establishment of better collection rates.(13,14,15,16)
Why are municipal revenues low and the quality of life inadequate due to poor solid waste management in the district of Villa el Salvador?
General objective
To improve municipal revenues and residents' quality of life through a study of solid waste characterization in the district of Villa el Salvador.
METHOD
In this research thesis, we have used descriptive statistical analysis methodology to handle the data appropriately. The descriptive level refers to the study and analysis of the data obtained from a sample (n) and, as its name suggests, describes and summarizes the observations obtained about a phenomenon, event, or fact.
Research design
For the research design, we will use an objectives-based research design according to the following outline:
Where:
O.G. = General Objective
o.e. = Specific Objective
c.p. = Partial Conclusion
C.F. = Final Conclusion H.G.= General Hypothesis
First, the study will be divided into two distinct stages. The first stage will focus on a household characterization study to provide information about waste generation and management habits in the district's households. The second stage will focus on non-household characterization studies to identify the specific characteristics of waste generation and management for each type of commercial, industrial, and service sector waste generator in the district.
Although a methodology has been developed in addition to the one dedicated exclusively to household solid waste, the characterization of both components (household solid waste and non-household solid waste) requires the same planning and information analysis.
The information requested for the preparation of the ECRS report was as follows:
· Villa el Salvador Municipality's Agreed Development Plan to 2021.
· District land use plans.
· Solid waste collection route and frequency plan.
· Street and public space sweeping route and frequency plan.
Type and level of research
Type
This study meets the methodological conditions of applied research in terms of the type of research because it uses knowledge from the administrative sciences to apply it to a competitive company's performance evaluation management process.
Level
According to the nature of the research study, it meets the characteristics of a statistical-descriptive, explanatory, and correlated study.
Formulation of hypotheses
General hypothesis
If a solid waste characterization study is designed and implemented, the municipality's economic income will increase, and the standard of living in the district of Villa El Salvador will improve.
Secondary hypotheses
• If the solid waste in the representative sample is characterized, we will know the per capita waste generation in the district of Villa El Salvador.
• If solid waste is separated in detail, we will know what type of waste each household generates in the district of Villa el Salvador.
• If solid waste is characterized, we can classify municipal licenses according to the types of businesses or uses in the district of Villa el Salvador.
• If all types of waste generated by the residents of Villa el Salvador are identified, we will collect fair municipal taxes and improve the residents' quality of life in the district.
Identification of variables
A variable is a characteristic, attribute, property, or quality that can be presented in nuances along a continuum.
Once a variable has been identified, it is necessary to classify what it means.
Independent variable(s) = SOLID WASTE Indicators
X1 = Classification of solid waste by origin, hazardousness, and management.
X2 = Management and environmental control of municipal solid waste.
X3 = Treatment, recycling, and land use planning for the population.
X4 = Dissemination, participation, and training of the population in municipal solid waste management
Dependent variable(s) = MUNICIPAL ECONOMIC INCOME Indicators
Y1 = Classification of municipal income.
Y2 = Classification by use of municipal licenses.
Y3 = Improvement in municipal tax rates.
Y4 = Payment of municipal taxes.
Population and sample
Population
To determine the district's current population, the population of the latest INEI 2007 census was used as a basis, along with INEI population projections for 2016 based on growth rates. The population figures provided by the Ministry of the Environment for this purpose were also considered.
|
Table 1. Nominal census population |
|||
|
State, province, district, and gender |
Population |
Total |
|
|
Men |
Women |
||
|
Villa El Salvador District (2016) |
228 386 |
234 628 |
463 014 |
|
Source: INEI - National Censuses 2007: XI Population and VI Housing Projection (2016) |
|||
|
Table 2. Classification/Types of Housing |
|
|
Villa el Salvador – Type of Housing |
|
|
Category |
N° |
|
Detached house (001) |
84 634 |
|
Apartment in a building (002) |
1241 |
|
Country house (003) |
219 |
|
Tenement house (004) |
280 |
|
Squatter's dwelling (006) |
2154 |
|
Premises not intended for human habitation (007) |
266 |
|
Other type (008) |
14 |
|
Total |
88 808 |
|
Source: INEI - National Censuses 2007: XI Population Census and VI Housing Census – Projection for 2017. |
|
Sample
The methodology and work procedure used are in accordance with the guidelines recommended by MINAM (Ministry of the Environment), as well as some of the findings of the solid waste characterization studies carried out in Latin American and Caribbean countries by Dr. Kunitoshi Sakurai and the contribution of the team assigned to this specific study.
The following equation was used to determine the number of samples:
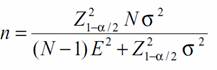
Below is the application of the formula for the district of Villa El Salvador with a total of 88 808 properties.
Considering the guidelines for solid waste characterization, the contingency sample may vary from 10 % to 15 %, so the sample value would be:
N = n + 10 % n = 70 Housing
These values have been considered the most appropriate, in accordance with the recommendation of the Technical Team of the Ministry of the Environment.
|
Table 3. Number of samples per socioeconomic stratum 2016 |
|||
|
Areas |
% of housing |
Total Sample |
Size Sample by Zone |
|
Zone B1 |
24,65 |
70 |
17 |
|
Zone B2 |
35,57 |
24 |
|
|
Zone C |
39,78 |
29 |
|
Sources of information
· Organization of the work team.
· Consultant-Municipality.
The Consultant, with the support and knowledge of the Municipal Services and Environmental Management Department and the Public Cleaning and Maintenance Department, will coordinate with the different decision-making levels of the Municipality (Mayor's Office, Municipal Management, etc.).
Public Cleaning Department
Public Cleaning Department officials will collaborate in the following activities:
· Provision of necessary logistics: areas for weighing and sorting.
· Supervise the equipment and materials for the study.
Study Coordinator
The study coordinator is an external consultant with experience in solid waste management, Miguel Ángel Melgarejo Quijandria, who will direct the activities and everything related to the logistics and systematization of the study. This professional's counterpart in the municipality is Hernán Taboada Chacón, Manager of Municipal Services and Environmental Management.
General coordination
The study will be carried out in close coordination with municipal officials directly involved in municipal solid waste management, who will be presented with a detailed characterization study, thus forming a joint working team between the Consultant and the municipality.
· Surveys of three socioeconomic levels in the district of Villa El Salvador in various areas already defined by the municipality.
· Database search in institutions (OPS, MINAN, Municipality of Villa el Salvador).
· Information from the Revenue Department of the Municipality of Villa el Salvador for non-residential data.
· Socioeconomic information from INEI (VARIOUS CENSUSES).
· Analysis of solid waste moisture content by the National Agrarian University of La Molina.
Data collection instruments
The data collection instruments were as follows:
a. Primary sources: the annex contains a survey of a representative sample of residential and non-residential properties. Solid waste was collected from this representative sample for seven days, and the waste discarded by residents was sorted statistically.
b. Secondary sources: previous studies on this topic were reviewed, as well as INEI population data and the Ministry of the Environment database.
Information processing
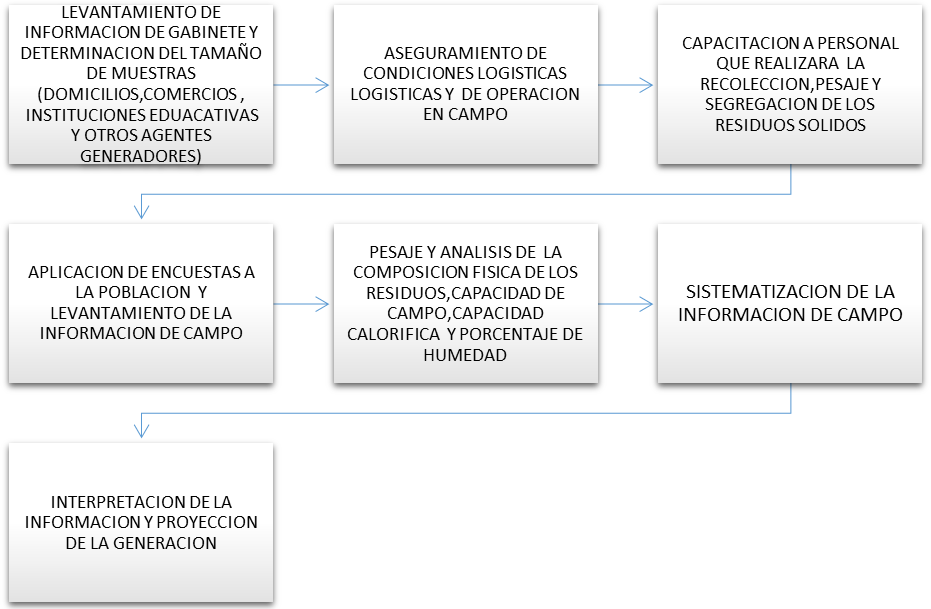
Figure 1. Steps for Information Processing
RESULTS
Results of the household study
Determination of work areas in the different social strata of the Villa El Salvador district, as shown in the following areas.
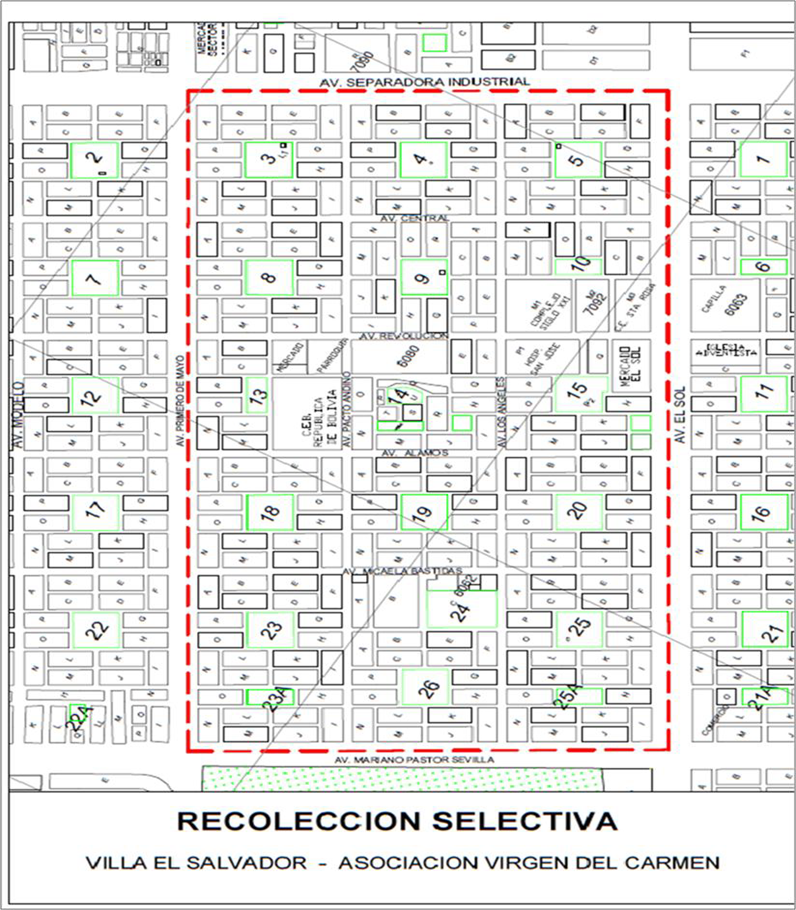
Source: Municipality of Villa el Salvador, 2017
Figure 2. Stratification zone B1
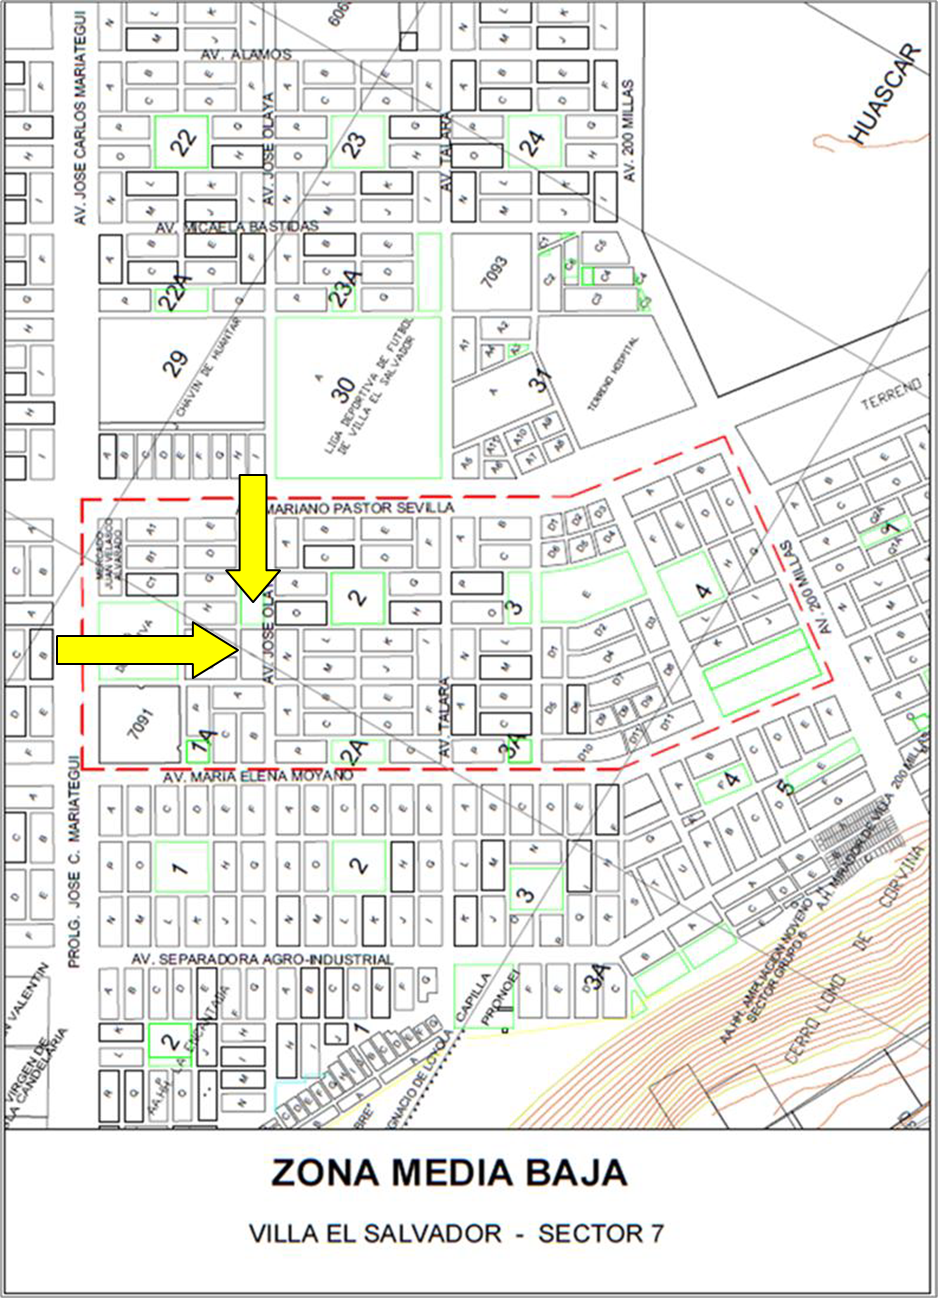
Source: Municipality of Villa el Salvador, 2017
Figure 3. Stratification zone B2
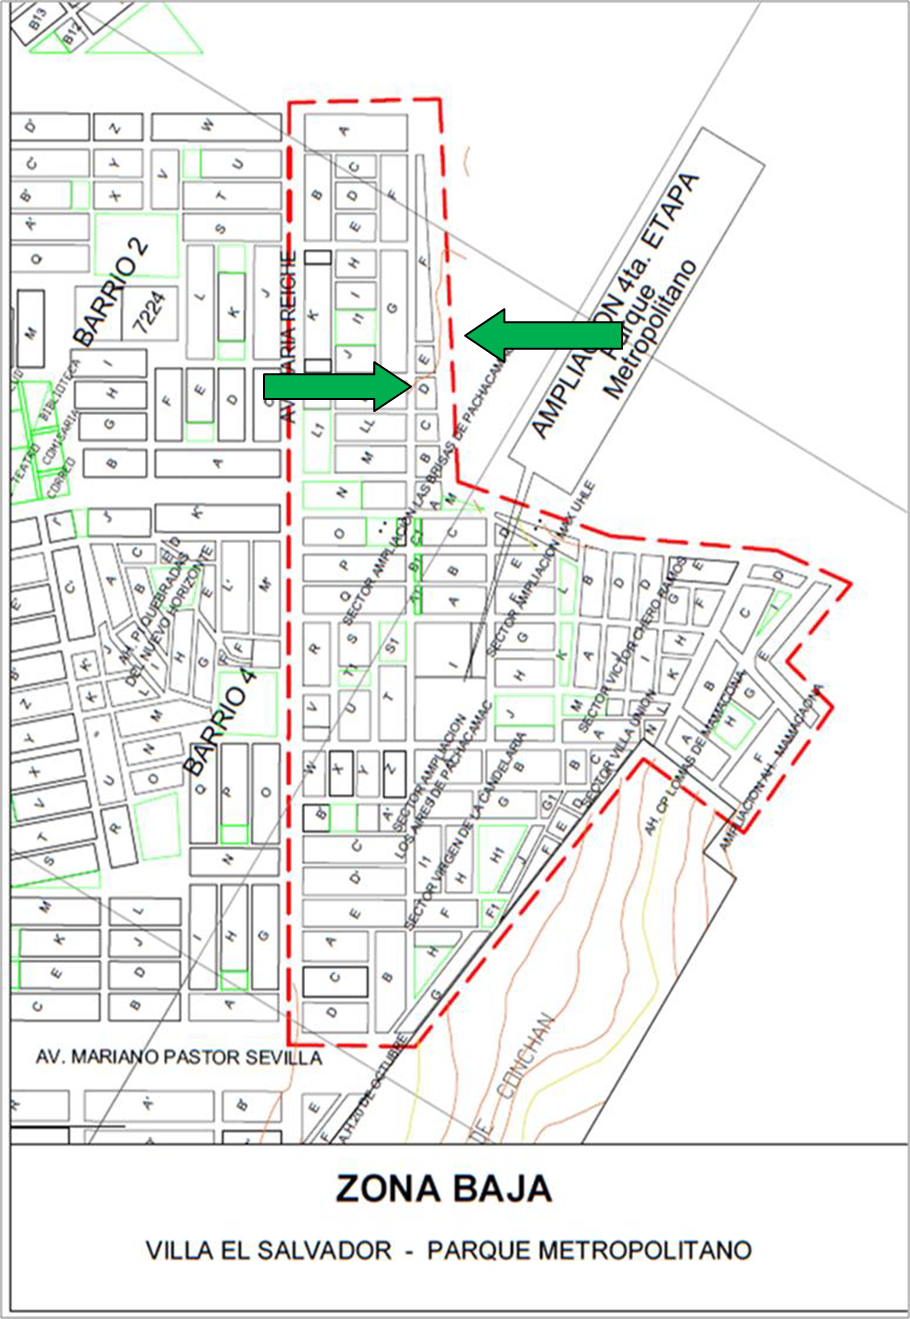
Source: Municipality of Villa el Salvador 2017
Figure 4. Stratification zone C
Survey of a representative sample
The survey corresponding to the 2017 study on the characterization of household solid waste in the district of Villa El Salvador has been carried out. As explained in the methodology section, on March 21 and 22, 2017, the survey focused on heads of households. The same sample was used for the characterization study, i.e., 70 households. The surveys focused on family conditions, solid waste management conditions, perception of solid waste services, and the interviewees' intention to pay taxes. The results were as follows:
Economic occupation of the interviewee
The survey focused on various areas of information, and it is important to separate each function. Information on the economic occupation of the interviewee was collected to determine who should be targeted by awareness and training programs on environmental issues.
The following graph shows that 36 % of those interviewed are homemakers, while a significant 43 % said they were self-employed; this tells us that dissemination strategies, information materials, and awareness-raising should be focused primarily on homemakers, both in terms of content and language used.
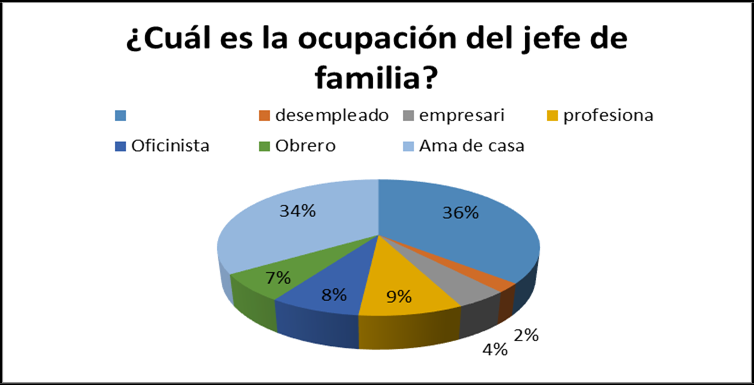
Figure 5. Occupation of head of household
Level of education of the head of household
Another important aspect for identifying actors was the level of education of the head of household. As can be seen in the graph above, 41 % of respondents had completed secondary education, while 18 % reported having completed technical education and 12 % of respondents had no education. This is important for targeting strategies to promote tax and excise duty payment, and is also useful for defining training content through workshops.
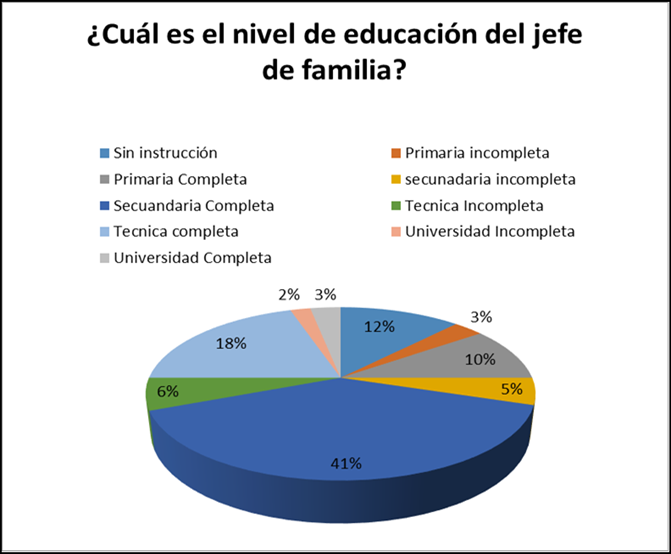
Figure 6. Education of the head of the household
What is the monthly family income?
The following graph shows that 15 % of families have an income of less than 500,00 nuevos soles, while 36 % report a monthly income of between 550,00 and 800,00 nuevos soles, and a significant 49 % have an income of more than 800,00 nuevos soles.
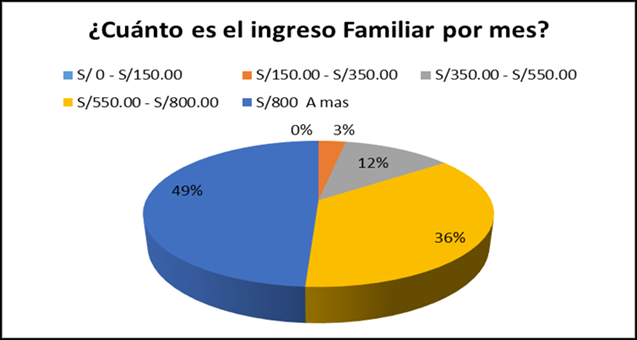
Figure 7. Monthly family income
Services available in your home
The services available to the population differ between areas of the district. Some homes have only basic services such as electricity or water, while others have all basic services plus telephone and cable. For this reason, they have been divided into two groups: Basic (water, sewer, and electricity) and Intermediate (water, sewer, electricity, telephone, and cable). Forty-two percent have electricity as their main service, with cable being the least used service at 4 %.
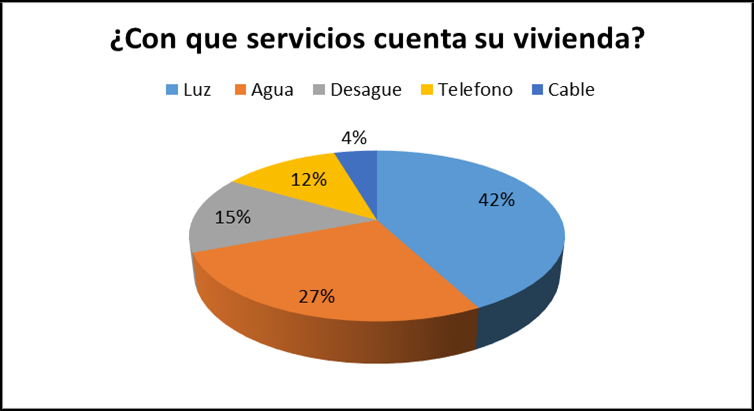
Figure 8. Services available in the home
Most commonly discarded waste
When asked about the waste they most commonly throw into the trash can or garbage container, the majority of residents responded that they throw away “other” items (cardboard, metal, glass, etc.) at 32 %, while 47 % of those surveyed throw away food waste (peels, vegetables, leftovers, etc.)
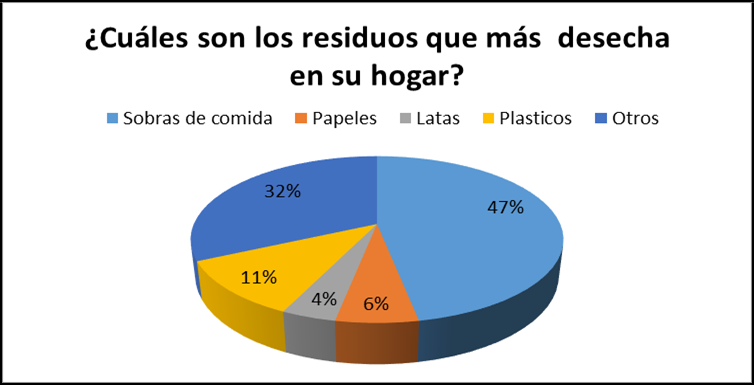
Figure 9. Waste most commonly discarded in the home
Type of container used to store solid waste
As shown in the graph below, most respondents (66 %) stated that they use plastic bags, 13 % use sacks, and 9 % use plastic bins for household solid waste storage.
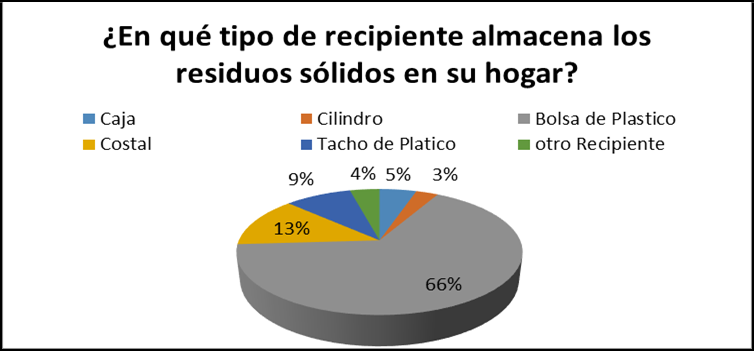
Figure 10. Type of container used to store waste in the home
Optimal storage time
To determine the optimal storage time for solid waste in homes, respondents were asked how long it takes for their trash can or bag to fill up. Fifty-four percent of respondents said that their containers fill up in two days, while 36 % said that their solid waste containers fill up in one day. This information is useful for determining collection frequencies.
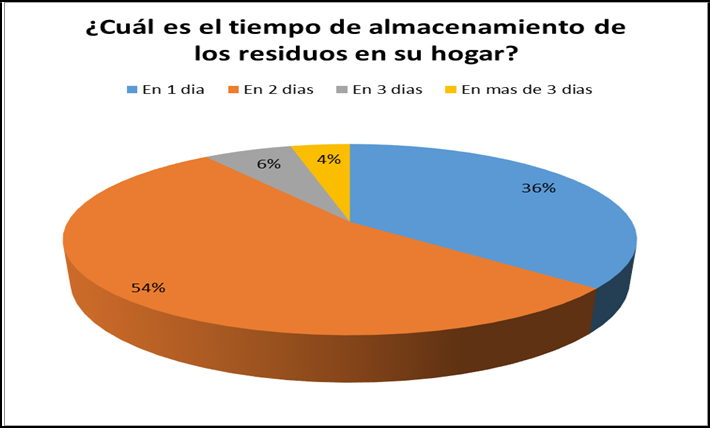
Figure 11. Storage time of waste in a household
Location of the trash container in the home
When asked where they keep their solid waste container in their home, 41 % of respondents said they keep it in the yard, 33 % in the kitchen, 21 % in a corral, and the rest in other places such as the bathroom, hallway, etc. This information is important because it provides insight into solid waste management habits in homes, revealing whether waste could come into contact with food for human consumption or with farm animals that could potentially be consumed by people.
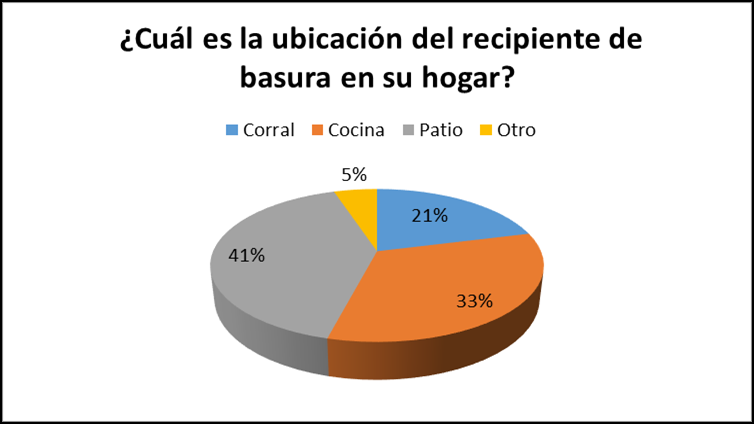
Figure 12. Location of waste container in a household
Keep the trash can, bag, or container for solid waste covered
This is important because it allows you to know how solid waste is handled in your home, since better hygiene conditions are maintained when the solid waste container is closed or covered. This prevents flies and rodents from entering, which act as vectors in the home. When asked this question, almost all respondents from the three socioeconomic sectors said they kept their solid waste storage container covered.
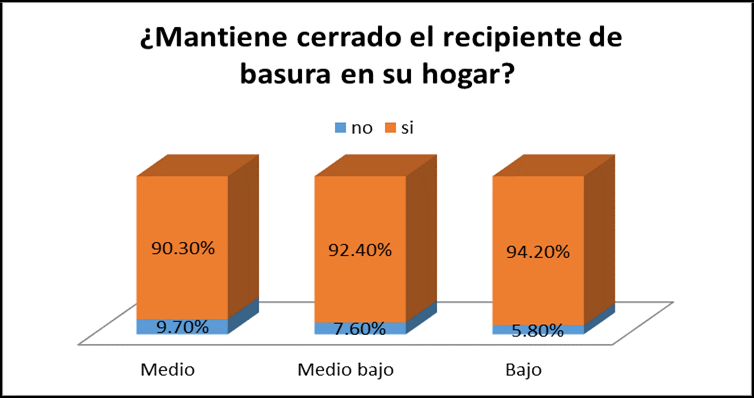
Figure 13. Maintenance of the waste container in the home
Frequency of waste collection
To find out how often solid waste is collected, respondents were asked how often solid waste is collected from their homes. In response, 28 % said they did NOT receive a waste collection service, a situation that is predominant in sector C (low-income area of the Villa El Salvador district). 28 % said they receive a daily collection service, 21 % said they receive it every other day, and 16 % said they receive the collection service very rarely.
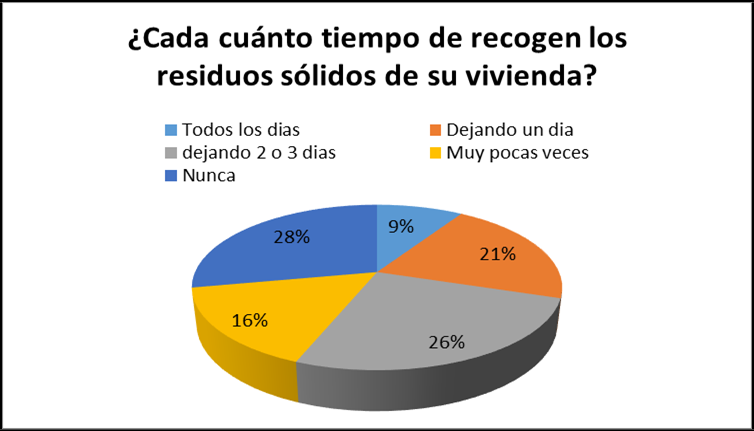
Figure 14. Waste collection time in a home
Disposal of solid waste in the absence of collection services
Respondents were asked what they do with their waste when the garbage truck does not pass by on time. Fifty-five percent of respondents said they take their waste to the nearest dump, 7 % said they throw it in the street, while 26 % said they store it in their homes until the garbage truck passes by. The results of this question highlight the need for a public awareness program on proper solid waste management. They also show that neighborhood oversight is needed to promote environmental protection.
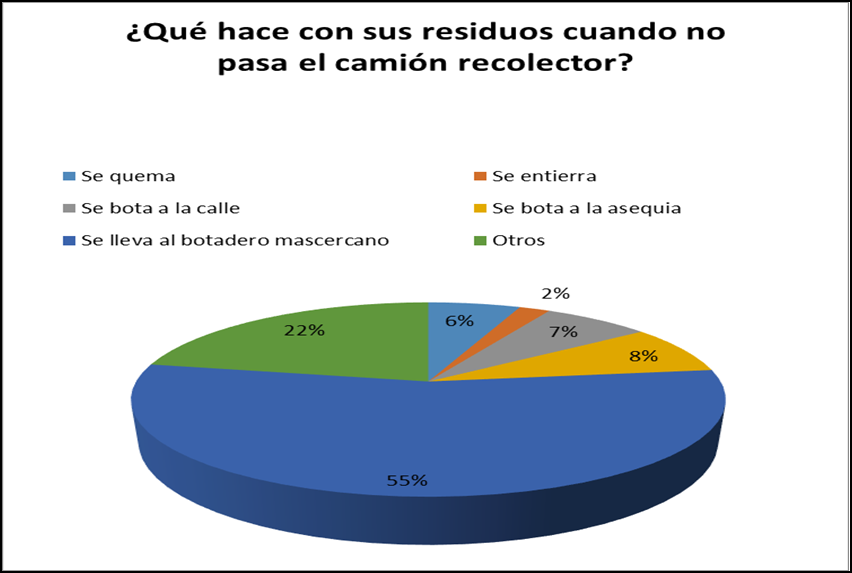
Figure 15. My waste when the garbage truck doesn't come
Why do you think there are accumulations of solid waste in your neighborhood or residential area?
Environmental awareness is reflected in the importance given to the environment. To demonstrate this, respondents were asked why they think there are accumulations of solid waste near their homes. In response, 61 % said that the garbage truck does not pass by their homes, while 24 % of the population said it was due to the negligence of the population, and 9 % said they had not noticed this problem. This again highlights the need to undertake an environmental awareness program focused on properly managing solid waste at the household level and in the environment.
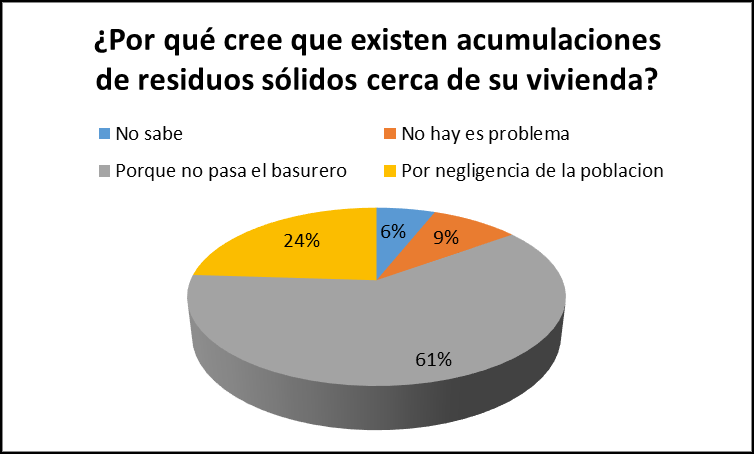
Figure 16. Accumulation of waste near a dwelling
Reuse of organic solid waste
When asked whether they reuse the organic solid waste generated in their homes, 71,5 % of respondents said they do, while 28,5 % said they do not. Regarding the type of reuse given to organic solid waste, the majority said they sell it to pig farmers, and a smaller proportion said they use it for small animals in their homes.
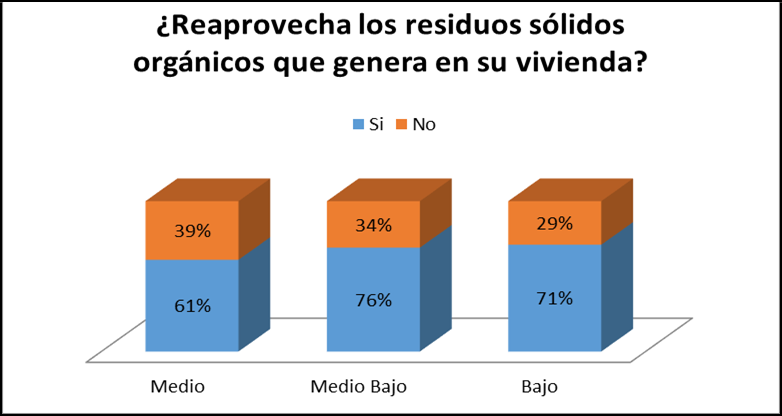
Figure 17. Reuse of organic solid waste
Reuse of plastic bottles
The reuse of plastic bottles is an important indicator of people's perception of the value generated by solid waste. However, when the survey was conducted, 39 % of respondents said they threw bottles in the trash, while 12 % said they gave them away, 37 % said they sold them, and only 12 % said that a family member used them for crafts.
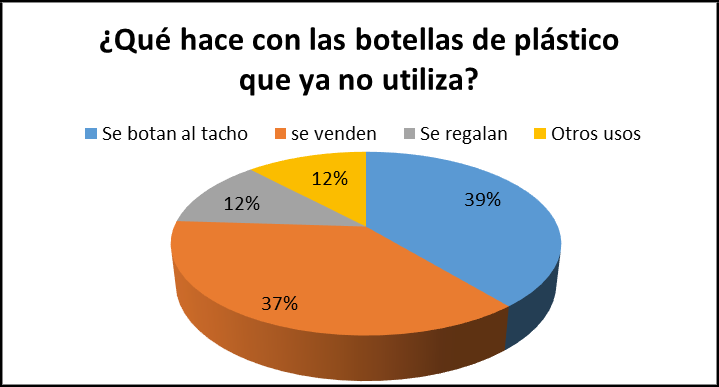
Figure 18. Plastic bottles that I no longer use
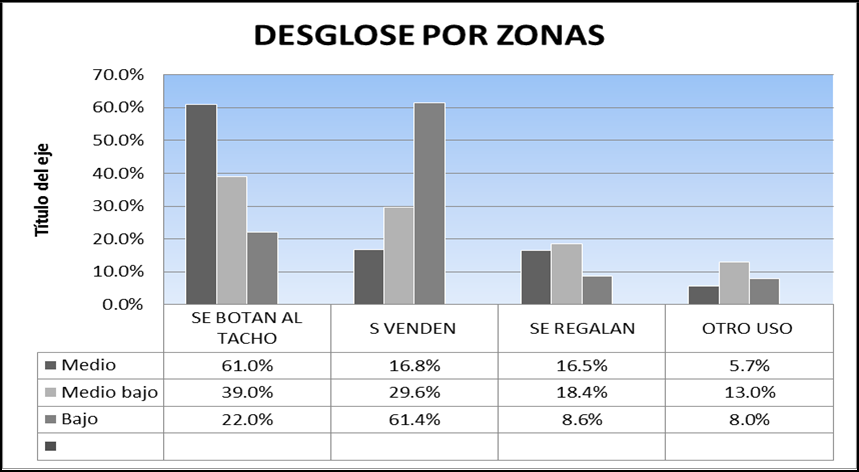
Figure 19. Breakdown by Zone
The graph shows that in the low socioeconomic stratum (zone C), 61,4 % of the population interviewed in that area sells plastic bottles, while in the middle socioeconomic stratum (zone B1), 16,8 % of those interviewed throw bottles in the trash, as do 29,6 % of those interviewed in the lower middle socioeconomic stratum (zone B2). This shows us that in the Low Stratum, plastic bottles are recycled because of the money that people receive in exchange for them from recyclers.
Reuse of glass bottles
The responses regarding the reuse of glass bottles are shown in the following graph: As can be seen, 42 % of respondents sell the bottles for financial gain, while 37 % throw them directly into the trash.
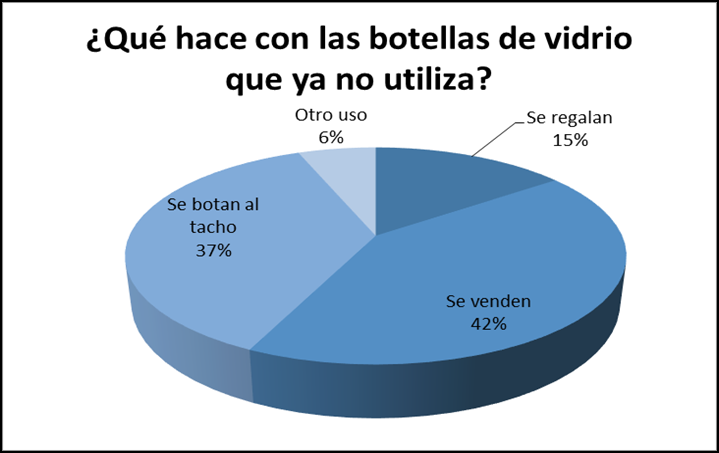
Figure 20. What do you do with glass bottles you no longer use?
Reuse of plastic bags
The most striking finding of the survey is that 61 % of respondents said they reuse plastic bags to dispose of solid waste; however, 22 % of respondents said they throw them in the trash or waste container without reusing them.
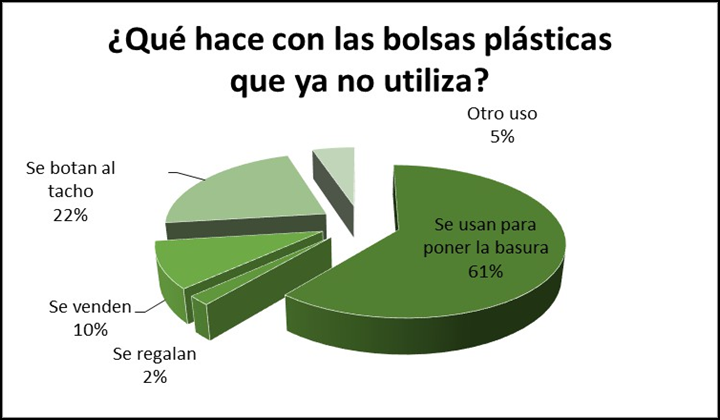
Figure 21. What do you do with plastic bags you no longer use?
Reuse of cans
With regard to the reuse of cans, 27 % of respondents said they reuse them in some way (25 % by selling them and 2 % by giving them away), while 54 % said they throw them directly into the trash and do not reuse them.
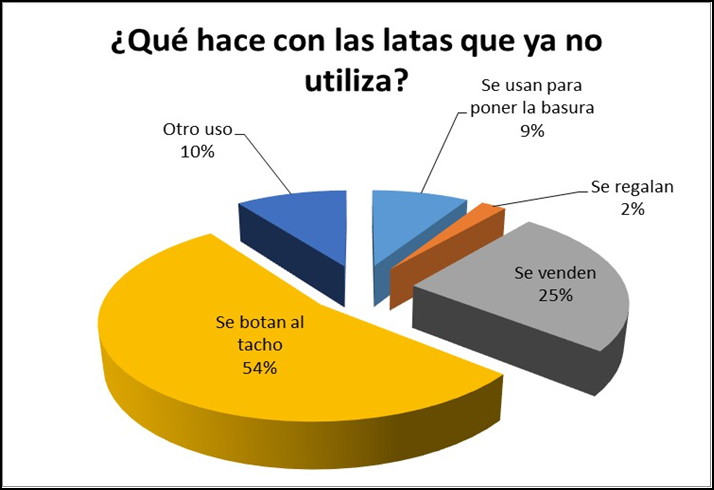
Figure 22. What do you do with cans you no longer use?
Reuse of cardboard and paper
With regard to the reuse of cardboard and paper, 34 % of respondents said they reuse them in some way (29 % by selling them and 5 % by giving them away), while 41 % said they throw them directly into the trash and do not reuse them, and 18 % use them to put their trash in.
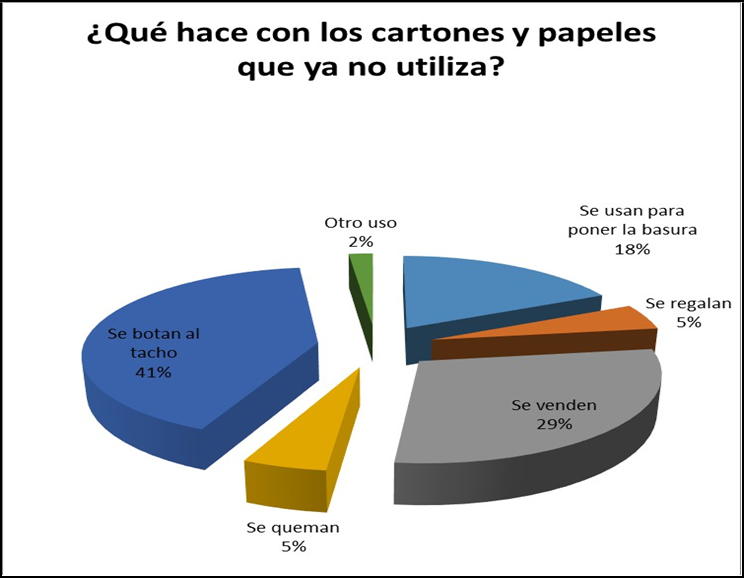
Figure 23. What do you do with cardboard and paper that you no longer use?
Availability for recycling
The survey showed that 99 % of respondents agreed to separate their waste at home to facilitate recycling, which indicates their intention to participate in a recycling program.
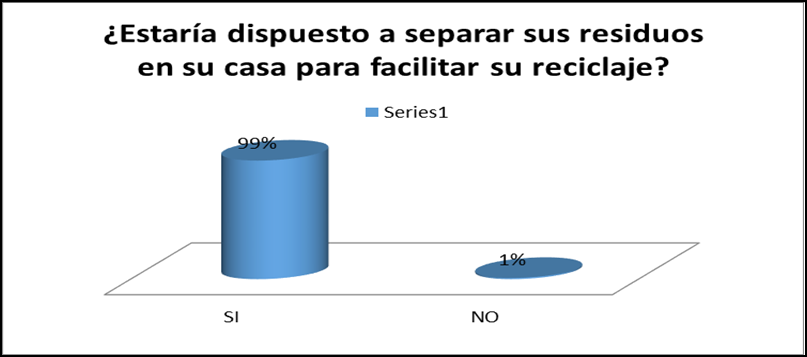
Figure 24. Separating waste at home to facilitate recycling
Desired frequency of solid waste collection
The desired frequency of solid waste collection gives us an idea of the level of environmental awareness among residents in the district, since wanting daily collection is not a sign of wanting to maintain sanitary conditions, but rather of not knowing the costs and resources required for this service. In the survey conducted, 19 % of respondents said they wanted daily collection, while 71 % said that solid waste collection is necessary every two days.
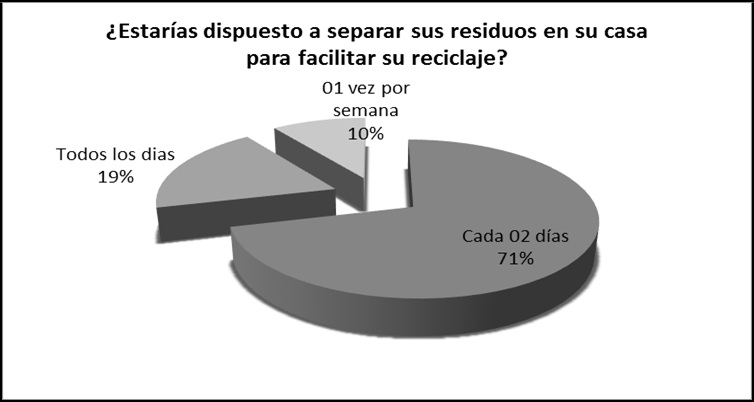
Figure 25. Desired frequency of solid waste collection
Satisfaction with solid waste services received
When asked if they were satisfied with the solid waste services provided by the municipality, 61 % of respondents said they were not satisfied with the solid waste services provided by the municipality, while 39 % said they were satisfied.
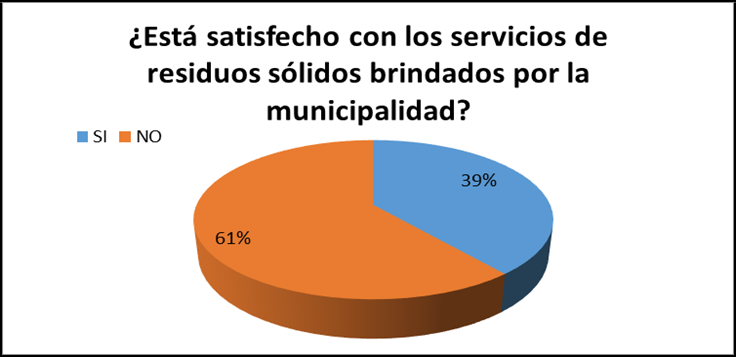
Figure 26. Satisfaction with solid waste services received
Willingness to pay for improved service
When asked, “How much would you be willing to pay monthly for a complete and improved public cleaning system (sweeping, collection, and disposal of solid waste)?”, 93 % said they would not be willing to pay any more than they currently pay.
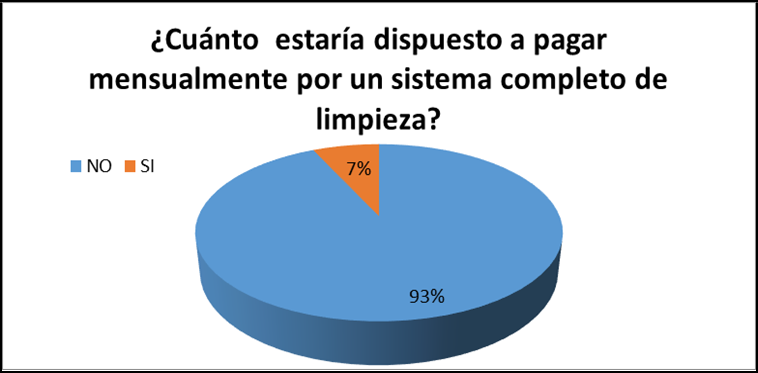
Figure 27. Willingness to pay for an improved service
Improved garbage collection service
When asked if they would be interested in receiving an improved cleaning service from the municipality at no cost, 100 % of respondents confirmed their interest in this proposal.
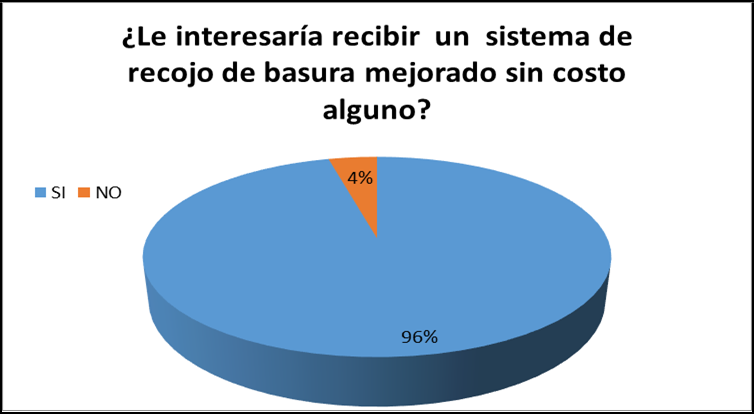
Figure 28. Improved garbage collection service
Per capita generation (PCG) of household solid waste

Figure 29. Per capita generation of household solid waste in the district of Villa El Salvador, 2017

Figure 30. Sector B2 - Lower Middle Zone - Household solid waste in the district of Villa El Salvador, 2017

Figure 31. Sector C - Lower Zone - Household solid waste in the district of Villa El Salvador, 2017
Figure 32. Per capita generation of household solid waste in the district of Villa El Salvador, 2017 Sector B1 - Middle Zone
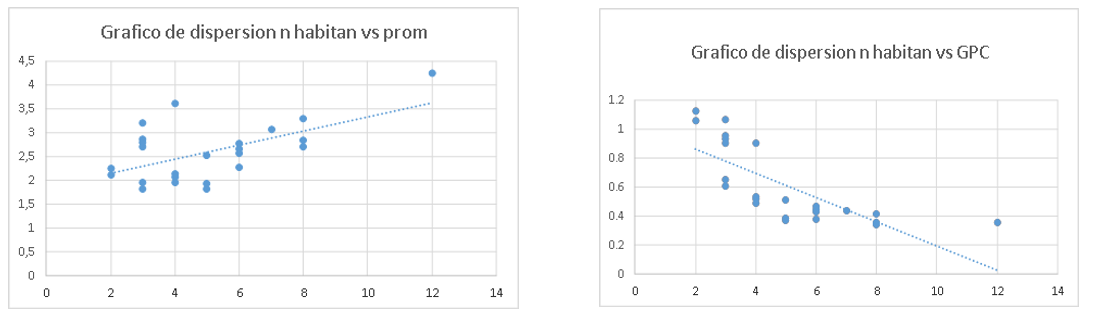
Figure 33. Per capita generation of household solid waste in the district of Villa El Salvador, 2017 Sector B2 - Lower Middle Zone
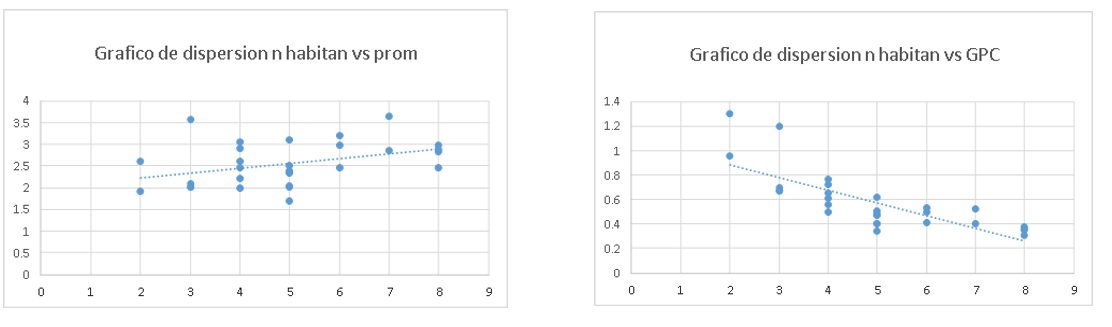
Figure 34. Per capita generation of household solid waste in the district of Villa El Salvador, 2017 Sector C - Lower Zone
Per capita income by socioeconomic status
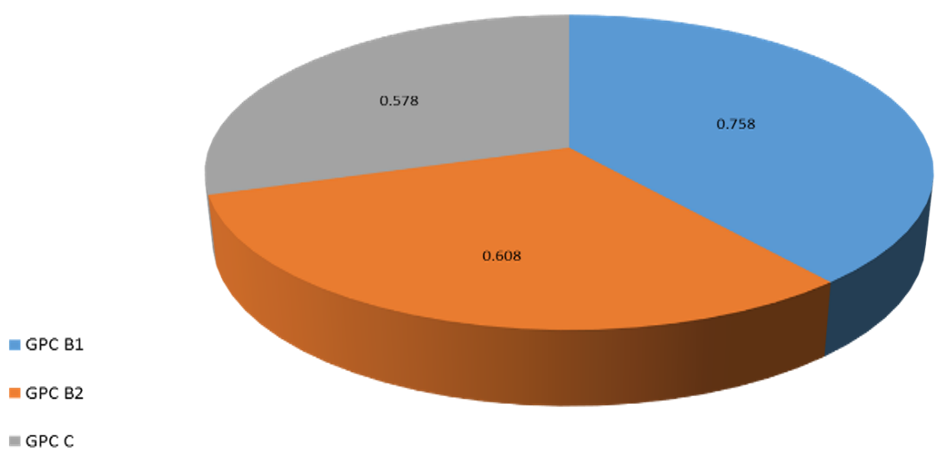
Figure 35. Per capita income by socioeconomic status
Projection of total household solid waste generation
As can be seen, a weighted GPC of 0,632 kg/inhabitant/day is obtained; for projection purposes, it will be assumed that each inhabitant in the district generates 632 grams of solid waste per day.
|
Table 4. Per capita generation (PCG) of solid waste in the district of Villa El Salvador |
|||
|
Socio-economic stratum |
GPC (kg/capita/day) |
Housing |
GPC Weighted |
|
AREA B1 |
0,758 |
21 891 |
0,632 |
|
AREA B2 |
0,608 |
31 589 |
|
|
AREA C |
0,578 |
35 328 |
|
Density of household waste
These three tables show the different densities measured during the seven days of fieldwork for each of the social strata defined.
Determination of density zone B-1
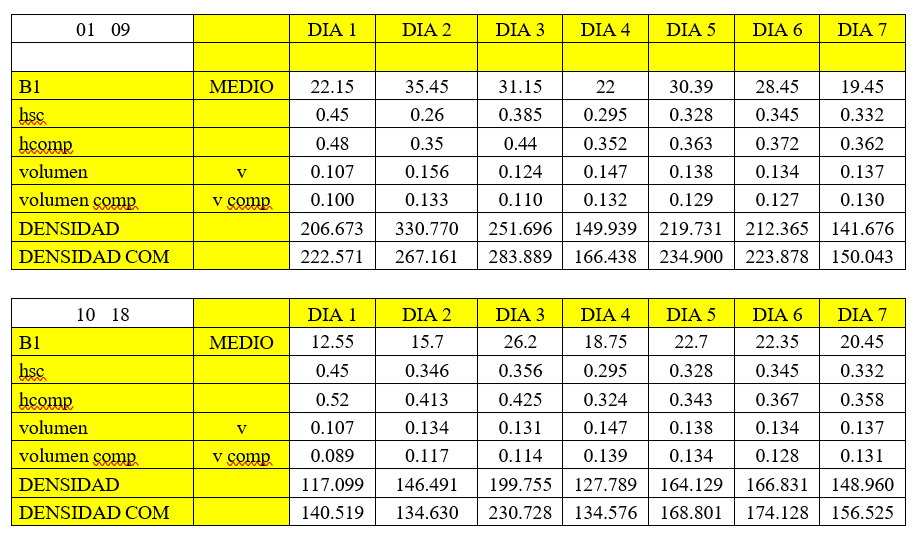
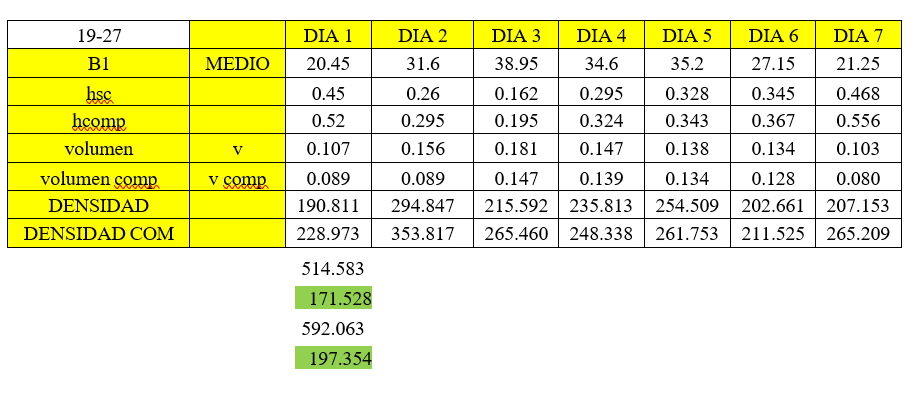
Figure 36. Complete density in the area B-1
Determination of density Zone B-2
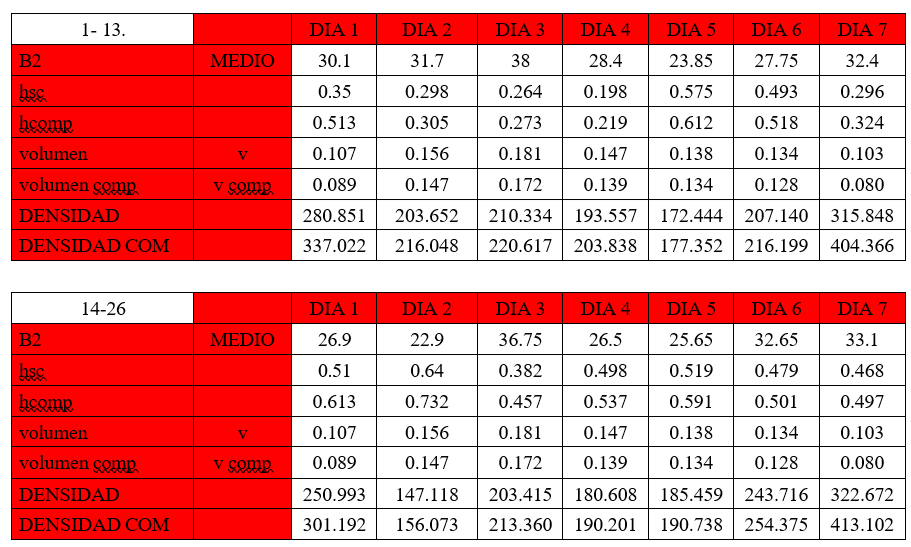
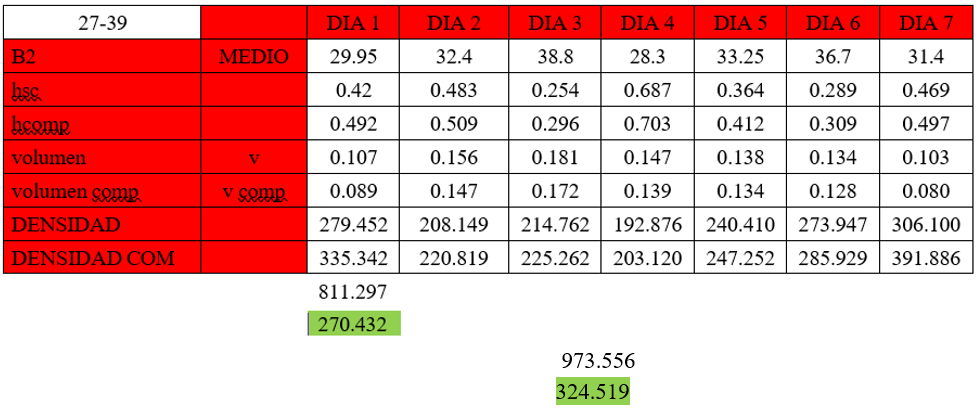
Figure 37. Complete density in the area B-2
Determination of density Zone C
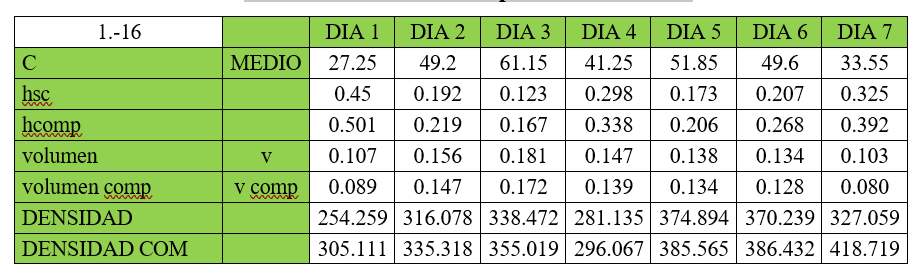
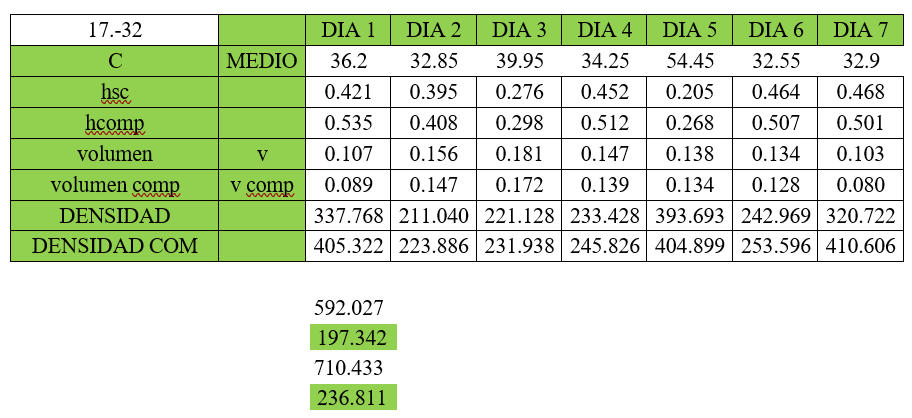
Figure 38. Complete density in the area C
Total density by socioeconomic stratum
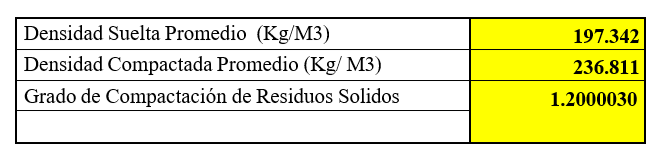
Figure 39. Total density by socioeconomic stratum
Physical composition of household solid waste
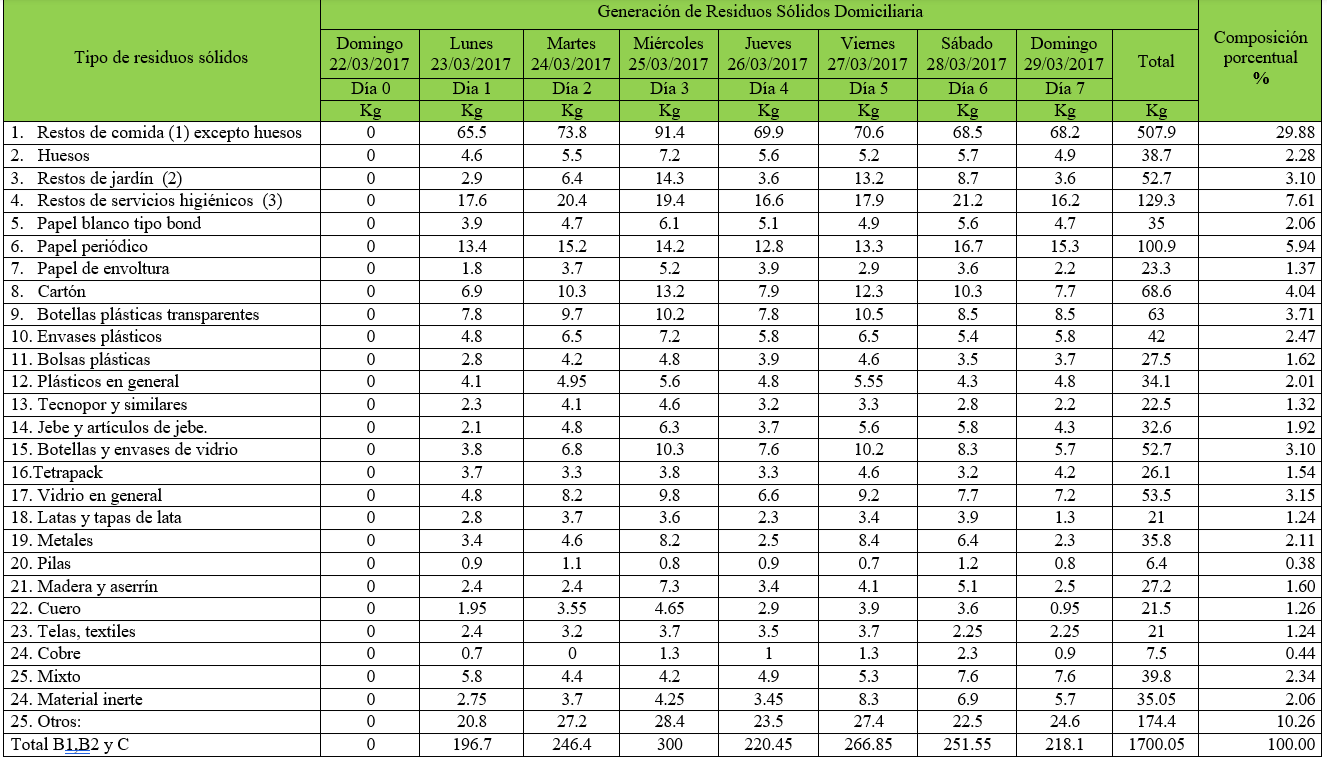
Figure 40. Domestic Solid Waste Generation
(1) Food scraps, food preparation scraps, expired food, food peels and stems, etc.
(2) Branches, stems, roots, leaves, and any other parts of plants resulting from weather and pruning.
(3) Toilet paper, absorbent hygiene paper, diapers, and sanitary napkins.
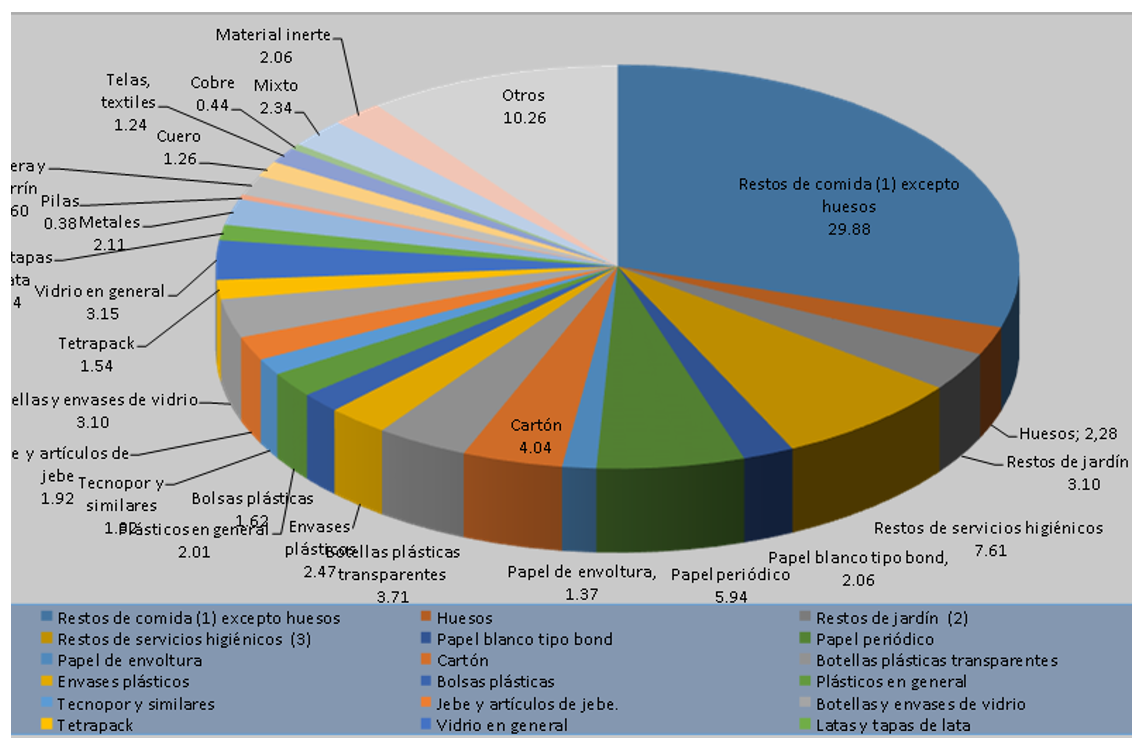
Figure 41. Types of household waste ECRS
Moisture analysis of household solid waste
The samples analyzed at the National Agrarian University of La Molina yielded the following results:
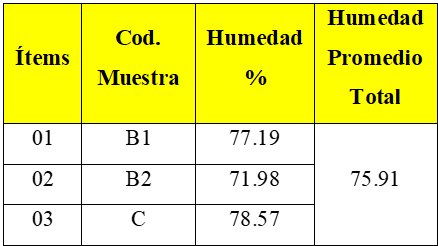
Figure 42. Moisture analysis of household solid waste
The average moisture content of household solid waste in the District of Villa El Salvador is 75,91 %, based on three samples from different socioeconomic strata.
Determination of non-household waste samples
This gives a total of 16 880 establishments, most of which are commercial. Based on this composition, the following statistical formula was used to determine the number of samples:
Formula for determining the number of non-household solid waste samples
The following formula is used to determine the number of samples:
Where:
n = sample of properties.
N = total number of properties.
Z = confidence level 95 % = 1,96.
σ = standard deviation.
E = permissible error.

This results in 64 business properties.
A contingency sample of 5 properties is considered, bringing the total sample to 69 business properties. Note: The contingency sample may vary from 5 % to 10 %.
Sources of solid waste generation by use
Sources of generation have been classified according to the composition of the waste and the quantities generated at each source; thus, the following distinction has been made:
|
Table 5. Sources of solid waste generation by use |
|
|
Commerce |
14 448 |
|
Market |
56 |
|
Industry |
1503 |
|
Healthcare facilities |
52 |
|
Public service entities |
330 |
|
Educational centers |
145 |
|
Recreational centers |
119 |
|
Local government |
40 |
|
Temples, convents, or monasteries |
73 |
|
Free assistance |
2 |
|
Mothers' clubs and soup kitchens |
3 |
|
Production workshops |
185 |
|
Total |
16 880 |
|
Source: Municipality of Villa El Salvador. Properties/Use. Revenue Area 2016 |
|
Determination of samples of commonly generated non-domestic solid waste
As explained above, establishments generating commonly generated non-domestic solid waste include those listed in the table below.
The sample size for these common activities was determined by stratified sampling with proportional allocation. That is, a sample will be determined, and, based on the proportions represented by each activity, the samples will be allocated territorially in the same proportion so that the total number of establishments in the common generation activities will be considered. To do this, it is assumed that the number of establishments in the district is so large that a relatively small sample is representative of the total. The formula used was as follows:
|
Table 6. Total samples of non-household items |
|||
|
Non-residential categories |
Number of properties |
Percentage of properties |
Adjusted sample number |
|
Commerce |
14 448 |
81 |
38 |
|
Market |
55 |
0,3 |
6 |
|
Industry |
1503 |
9 |
4 |
|
Healthcare facilities |
52 |
0,3 |
5 |
|
Public service entities |
330 |
0,3 |
2 |
|
Educational centers |
145 |
1,8 |
5 |
|
Beach recreation centers |
119 |
0,4 |
2 |
|
Local government |
40 |
0,3 |
1 |
|
Temples, convents, and monasteries |
73 |
0,5 |
2 |
|
Free assistance |
2 |
0,1 |
1 |
|
Mothers' clubs and soup kitchens |
3 |
0,1 |
0 |
|
Production workshops |
185 |
0,7 |
2 |
|
Total |
16 880 |
100 |
69 |
|
Source: Municipality of Villa El Salvador. Land use in 2016 in the health, education, and market sectors. The samples are larger due to analysis issues. |
|||
Determination of samples from commercial establishments
Samples from commercial establishments have been distinguished according to their composition and level of generation. Thus, commercial establishments such as warehouses, call centers, internet cafes, or bookstores will not generate the same amount of solid waste as a restaurant or, even more so, a hotel or pharmacy. The latter two sources of generation have been studied separately without analyzing their composition since, in many cases, pharmacies also administer medications with syringes and do not segregate the waste to make it safe to handle. Hotels, hostels, and lodgings have also not been segregated to determine their composition since they generate contaminated waste in most cases.
Determination of market samples
In the case of markets, the various markets selected by proportional size will be taken as the generating unit. This will ensure the sample's representativeness, provided that the markets considered have characteristics similar to those of most markets in a city.
As will be seen below, a total of five markets in the city were sampled in this study.
By way of illustration, the number of markets suggested for sampling for ECRS is presented below.
Determination of samples from educational institutions
In the case of educational institutions, students have been considered generating agents, so the basic variables for determining the samples have been calculated based on solid waste generation data from educational institutions in other cities. Values from different cities must be considered because few samples are usually taken from academic institutions. This did not allow us to work with a single city as a model.
When evaluating the formula, we noticed that the value always obtained is 06 samples. The criteria used to select the samples will be important since the number of students in these institutions is not always the same. So, there are educational institutions with a large number of students (more than 1000) and those with few students (less than 300); therefore, fewer samples may be taken if the educational institutions guarantee representativeness.
Determination of samples from health centers
As with public institutions, there are no more than 30 health establishments in a city (except private dental clinics, minor care clinics, etc., whose solid waste generation can be omitted, given their proportion compared to hospitals). Therefore, a sample was taken at the discretion of the technical team that carried out the solid waste characterization study.
The solid waste from this source corresponded to waste from administrative services and other waste classified as non-hazardous. To this end, a series of interviews were conducted with the responsible personnel, and the information reported to the General Directorate of Environmental Health through the respective sanitation area of the Vitarte Hospital was reviewed. The information reported was verified through visits to the solid waste storage sites of the aforementioned health centers. In the case of health facilities, solid waste generation will be related to the average number of visits per day.
Gathering of background information
Official information was obtained from the National Institute of Statistics and Informatics (INEI), the municipality of Villa el Salvador, and interviews with municipal officials and technical staff. To ensure access to this information, advance coordination was carried out with the relevant departments so that the required data could be processed and provided during the characterization study.
The information requested for the preparation of the ECRS report was as follows:
· Agreed Development Plan.
· Prioritization of Projects for 2014 and 2015 resulting from the process.
· Urban Development Plan.
· Register of commercial establishments by type of business.
· Register of grassroots organizations with an emphasis on environmental issues.
· Solid waste collection route and frequency plan.
· Inventory of critical solid waste points in the district.
· Report on final disposal of solid waste by month (2014 and 2015).
Registration of establishments and application of survey
The types of establishments have been chosen so that each one represents the particular characteristics of similar establishments regarding waste generation. This has made it possible to determine the generation and composition of waste from a much larger group by analyzing a sample of a single kind of establishment.
For example, the following types of establishments are found within the commercial sector: hostels, lodges, and guesthouses. Hostels represent similar establishments in terms of their activities and waste generation characteristics.
Once the establishments that would make up the sample had been selected, the registration process began, recording data to identify the premises and their owner and/or person responsible.
In addition, a non-household survey was conducted to obtain information about their particular characteristics, activities, and characteristics regarding their waste management and final disposal. Both activities, the census and the survey, were carried out on August 6 and 7, 2017.
The following elements defined the selection of the establishments that made up the sample:
· Random location of the premises according to use.
· General characteristics representative of the type of establishment and related activities.
· Ease of access to the premises for the public and vehicles.
The perception of the population and the management conditions reported by the population are important in determining many aspects that condition the reality of the district or city in question. While it is true that this does not give us precise information on the generation or composition of solid waste, it does provide vital information for the study, such as the number of inhabitants in each dwelling, the approximate built area, the conditions of solid waste storage by the population, the desired and actual frequency of public cleaning services, etc. Annex 01 shows the survey format developed for the characterization studies.
Solid waste collection
The waste collection stage was carried out over four consecutive days, from September 2 to 5, 2017, between midnight and 3:00 a.m. The waste collected corresponded to that generated during the previous day (markets). During the day, samples were collected from schools, health centers, and other locations.
Two subcontracted recyclers participated in and supported this activity. The collection strategy consisted of forming a team supervised by Miguel Melgarejo Quijandria, the consultant in charge. The team traveled daily along the different routes of the establishments that make up the sample and characterization of the waste at the collection site.
As explained above, solid waste generation was measured by direct weighing.
It was explained above that solid waste generation will be related to the number of students in these establishments and, in the case of public institutions, to the number of workers who usually remain in the establishment (administrative staff). This will be obtained by dividing the average amount generated by the number of students or staff, as appropriate.
Determination of the density of non-domestic solid waste
The density of the waste was determined using a 55-gallon cylinder, whose height and diameter were measured; the procedure was as follows:
· Obtain a uniform cylinder with a capacity of 55 gallons or 208,18 liters, without dents, and in good condition; the municipality provided this for the study.
· The dimensions of the uniform cylinder were determined, generally as follows:
Diameter: 0,57 m
Height: 0,88 m
· Separate 4 to 8 previously weighed bags.
· Once weighed, empty them into the cylinder until it is ¾ of the total height.
· Lift the cylinder between 5,00 cm and 10,00 cm and drop it to the floor to eliminate any empty spaces between the waste caused by emptying the bags.
· The free height between the solid waste and the cylinder's edge was measured.
· The data was recorded on a field sheet.
Survey of representatives of commercial establishments in the district of Villa El Salvador
Economic occupation of the interviewee
The question covers several areas of information, so it is important to separate each function. The following figure shows that 36 % of those interviewed are homemakers, while a significant 43 % said they were self-employed, 2 % were unemployed, and the remaining percentage were dependent workers.
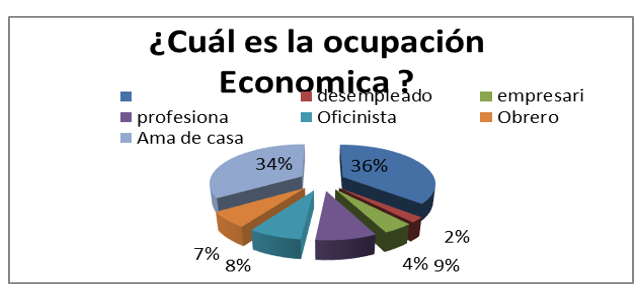
Figure 43. Economic occupation of interviewee
Services available in your home
The services available to businesses in the district vary. Some only have basic services such as electricity and water, while others have all basic services plus telephone and cable. For this reason, they have been divided into two groups:
Basic (water, sewer, and electricity) and Intermediate (water, sewer, electricity, telephone, and cable). Forty-eight percent have electricity as their main service, with cable being the least used service at 3 %.
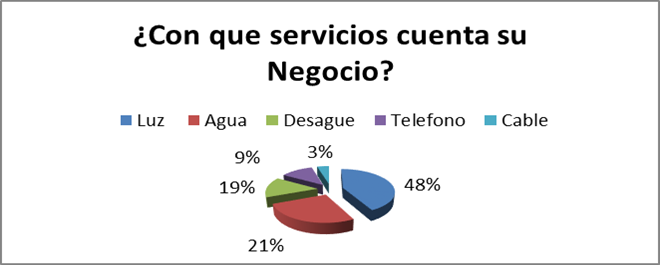
Figure 44. Services available in your home
What is the most common type of waste generated by your business?
This is a somewhat diverse question, as the same question was asked to different industries based on their uses, but most of them provided the following information. The majority responded that they throw away “Other” (cardboard, metal, glass, etc.) at 29 %, while 49 % of those surveyed throw away food waste (peels, vegetables, leftovers, etc.).
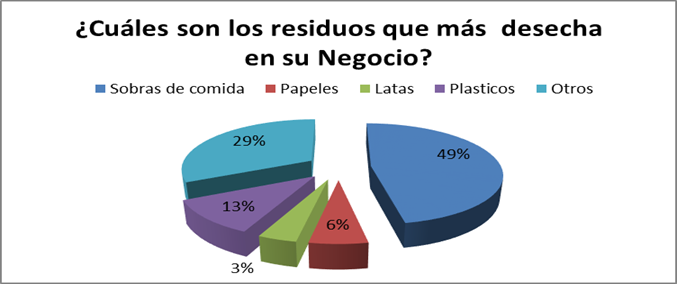
Figure 45. What you waste most in your business
What goes into the trash can most often in your business?
This question reveals a diversification according to use. Schools use metal cylinders a lot, while markets use large municipal trash cans. The rest of the businesses normally use plastic bags, as shown in the figure below.
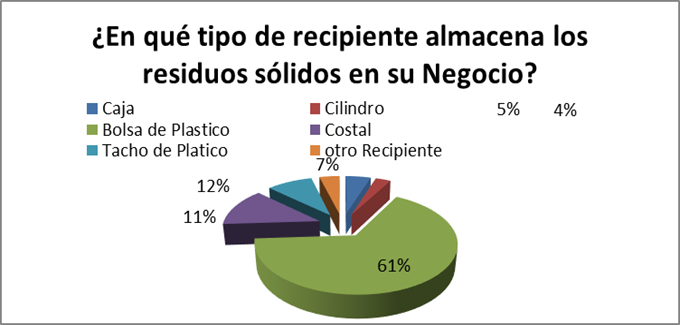
Figure 46. Type of container used to store waste
How many days does it take for the trash cans at your business to fill up?
In order to determine how long it takes for solid waste to fill up at each business, respondents were asked how long it takes for their trash can, bin, or bag to fill up. Fifty-one percent of respondents said their containers fill up in two days, while 42 % said their solid waste containers fill up in one day. This information is useful for determining the necessary collection frequencies.
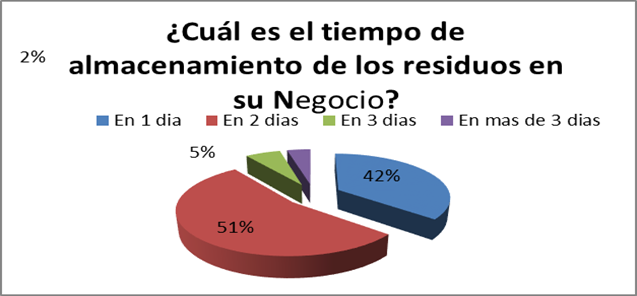
Figure 47. Time taken to fill garbage containers
How often is trash collected from your business?
The answers to this question vary greatly, as waste collection is very diverse throughout the district of Villa el Salvador. Respondents were asked how often solid waste is collected from their homes. In response, 18 % said they do not receive a collection service, 8 % said they receive a daily collection service, 26 % said they receive a collection service every other day, and 20 % said they receive a waste collection service very infrequently.
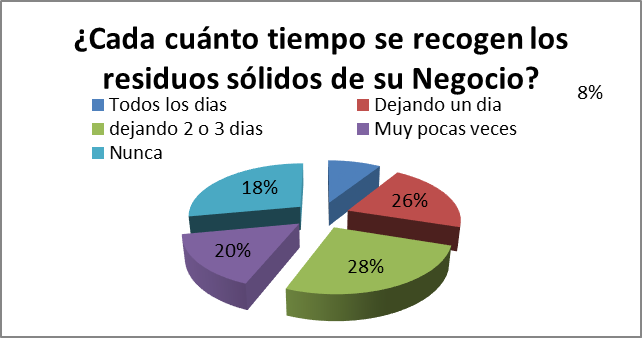
Figure 48. Waste collection time at a business
When trash accumulates in your business over several days, what do you do with it?
This question has several answers depending on the type of waste. For example, in markets, waste is usually accumulated and left until garbage trucks collect it. Similarly, in schools and healthcare facilities, hazardous waste is treated differently. Commercial businesses tend to handle their waste in a similar way to households. When asked what they do with their waste when the garbage truck does not come on time, 52 % of those interviewed said they take their waste to the nearest dump, 9 % said they throw it in the street, while 24 % said they store the waste in their business until the garbage collector comes.
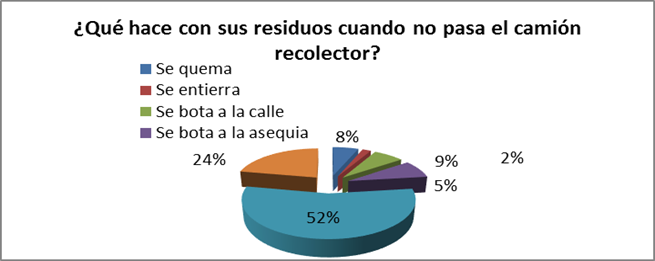
Figure 49. If waste accumulates in my business
Do you recycle or sort waste in your business?
When asked whether they reuse the organic solid waste they generate in their homes, 71,5 % of respondents said they do, while 28,5 % said they do not. Regarding the type of reuse given to organic solid waste, most said they sell it to pig farmers, and a smaller portion said they use it for small animals in their homes.
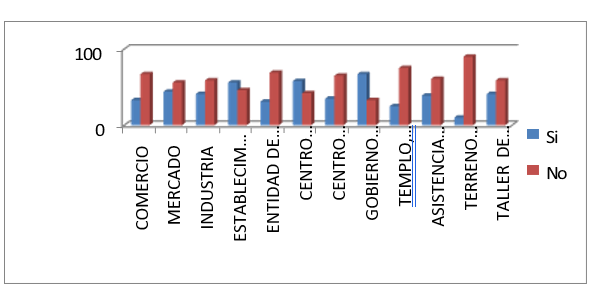
Figure 50. Waste generated is reused or recycled
What do you do with plastic bottles you no longer use?
The aim is to measure the percentage of plastic bottle reuse and perception as an indicator of how plastic bottle reuse is an important indicator of people's perception of the value generated by solid waste. However, when conducting the survey, 32 % of respondents said they throw the bottles in the trash, while 16 % said they give them away, 35 % said they sell them, and 17 % said they use them for other purposes.
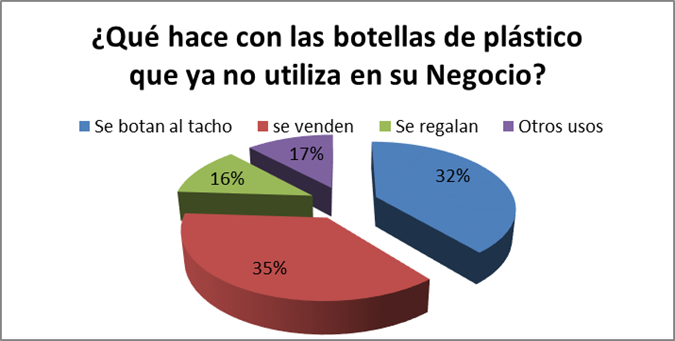
Figure 51. Plastic bottles that are no longer used
What does your company/business do with glass bottles?
There is a positive trend toward selling and recycling glass bottles. Responses regarding the reuse of glass bottles are shown in the following graph: As can be seen, 37 % of those interviewed sell the bottles for a profit, while 34 % throw them directly into the trash.
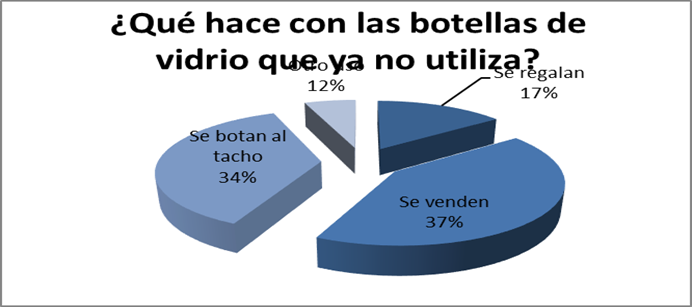
Figure 52. Glass bottles that I no longer use
What does your company do with plastic bags?
The most striking finding of the survey is that 54 % of respondents said they reuse plastic bags to dispose of solid waste; however, 24 % of respondents said they throw them in the trash or a container without reusing them.
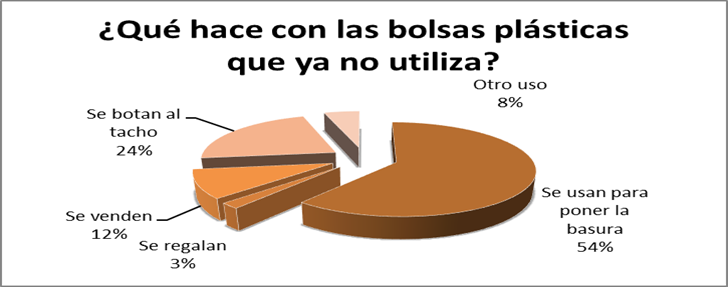
Figure 53. Plastic bags that are no longer used
What does your company/business do with paper and cardboard?
Depending on the use/sector, especially in the industrial area. There is an initial trend toward reusing paper and cardboard. As for the reuse of cardboard and paper, 34 % of those interviewed said they reuse them in some way (26 % by selling them and 7 % by giving them away), while 37 % said they throw them directly into the trash and do not reuse them, and 20 % use them to put their trash in.
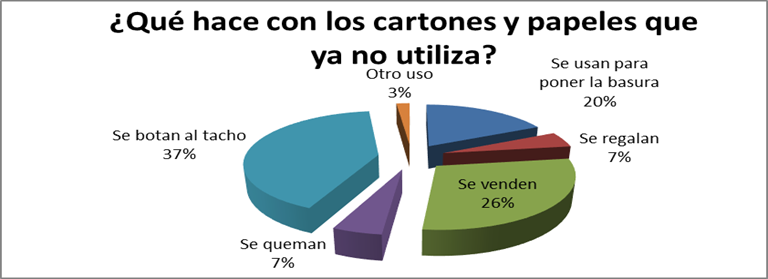
Figure 54. Cardboard and paper that is no longer used
Would you be willing to separate your waste at work to facilitate recycling?
The survey showed that 96 % of respondents agreed to separate their waste at home to facilitate recycling, which indicates their intention to participate in a recycling program.
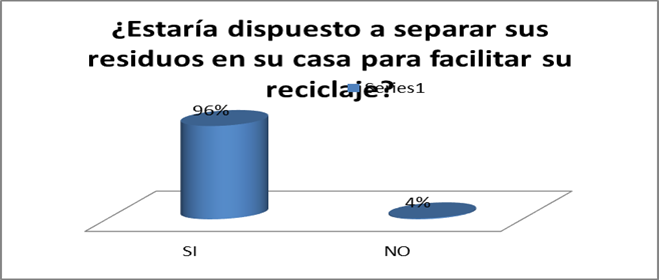
Figure 55. Separate waste at your business
Which of the following garbage collection times works best for you?
Although some categories of waste already have a garbage collection schedule defined by the municipality (specifically markets, schools, and health centers), there is a trend toward waste collection in commercial and industrial areas. Thirty-six percent of those interviewed need daily collection, while 54 % stated that waste collection is necessary every two days.
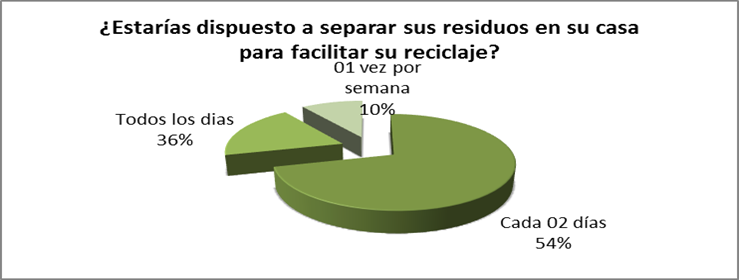
Figure 56. Waste collection time
Are you satisfied with the garbage collection service you receive at your business?
A large number of respondents are dissatisfied with the garbage collection service their business receives. However, this is mainly due to scheduling issues. Pickup in several areas sometimes occurs at times when these people are not working at their businesses due to night and rotating shifts. Fifty-four percent of those interviewed said they were dissatisfied with the solid waste services provided by the municipality, while 46 % said they were satisfied.
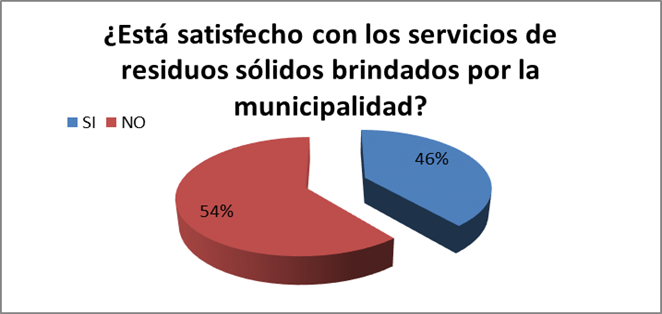
Figure 57. Satisfaction with services provided by the municipality
Generation of various uses according to survey results
Below are the results obtained from the survey conducted in the non-residential sector in the district of Villa El Salvador according to uses and/or sectors.
Generation of common commercial establishments
As described above, within the common commercial establishments, we have considered warehouses, bookstores, bazaars, call centers, internet cafes, bakeries, and similar establishments.
|
Table 7. Commercial establishments of common generation |
|||
|
Turn |
Number of establishments |
Adjusted Representative Sample (General) |
Average generation per establishment (kg/est/day) |
|
Common businesses (Wine shops, bookstores, pharmacies, bazaars, call centers, internet cafes, hair salons, newsstands, customer service centers, and similar businesses). |
14 477 |
38 |
2,117 |
|
Total |
14 477 |
38 |
2,117 |
Solid waste generation in markets
Solid waste generation in markets was determined by weighing waste from five markets in the city, using a municipal compactor truck and then transporting a 150 kg scale to the market.
|
Table 8. Solid waste generation in markets |
|||||
|
Markets Surveyed |
Positions / market |
Average generation per position (kg/position/ day) |
Average Generation (Kg/m³/day) |
Average generation Total /position in Kg |
Total average kg/m³ |
|
Association of Unified Merchants of the Fairgrounds of V.E.S. –Mercado Grande |
1470 stands |
3,35 |
4924,5 |
3,150 |
477,19 |
|
Model Market |
625 stands |
3,20 |
2000 |
||
|
El Sol Market |
540 stands |
3,40 |
1836 |
||
|
Jose Olaya Market Medium-sized market |
304 stands |
2,75 |
836 |
||
|
Sacred market Heart of Jesus |
70 stands |
2,95 |
206,5 |
||
|
Los Mellizos – Small market |
16 stands |
3,25 |
52 |
||
Solid waste generation from industry
Solid waste generation in industry was monitored by collecting waste from four industries over three days. The data obtained has been adjusted because there are different sizes of industry, which emit different amounts of waste, meaning that we cannot obtain a highly reliable result. Industrial generation is 18,75 kg/day.
|
Table 9. Solid waste generation by industry |
|||
|
Industry |
Turn |
Average Generation (kg/day) |
Total average generation (kg/day) |
|
Nino Lubricants Factory |
Oil production |
14kg/day |
18,75 |
|
FLORES Furniture Industry |
Furniture manufacturing |
9kg/day |
|
|
Fabrica Paraíso and Derivatives |
Mattress manufacturing |
35kg/day |
|
|
Hatunsol – Construction Industry |
Distribution of materials |
17kg/day |
|
Solid waste generation from healthcare centers
To estimate solid waste generation in healthcare centers, samples were taken from administrative areas. For waste classified as hazardous, we were only able to obtain reference weights from the waste manager at each location. This waste is treated specially in each health center. Normally, a third party (company) is hired to collect this waste once or twice a week for treatment.
Hospital solid waste (hazardous) will not be characterized as it is relatively risky for recyclers responsible for verification in the field.
|
Table 10. Solid waste generation in health centers |
|||||
|
Hospital or Health Center Sampled |
Daily average kg/day |
Daily amenities |
Waste generated per visit (kg/visit) |
GPC Average /Kg |
Average generation Kg/day |
|
Minsa-Health Center |
70kg |
159 |
0,44kg |
0,266 |
54,33 |
|
San José Mother and Child Center |
35kg |
132 |
0,26kg |
||
|
Hospital of Solidarity |
112kg |
495 |
0,22 |
||
|
San Martin de Porres microgrid |
32kg |
150 |
0,21 |
||
|
Dental Clinic –ILUMIDENT- |
5kg |
25 |
0,2 |
||
Solid waste generation by public institutions
The public institutions sampled were the offices of the Public Prosecutor's Office and COFIDE. Daily solid waste generation per worker was estimated at 0,58 kg.
|
Table 11. Solid waste generation by public institutions |
|||||
|
Institution sampled |
Average generation (kg/day) |
Total number of employees |
GPC (kg/work/day) |
GPC Average(kg/worker/day) |
Average generation kg/day |
|
Public service entity Forensic medicine Min. public |
7,6 |
13 |
0,58 |
0,58 |
4,97 |
|
COFIDE |
2,3 |
4 |
0,57 |
||
Solid waste generation by educational institutions
Solid waste generation by educational institutions was determined based on a sample of five public and private educational institutions (private university, public schools, and preschool) in the district of Villa El Salvador.
|
Table 12. Solid waste generation by educational institutions |
|||||
|
Educational Institutions Sampled |
Number of Students |
Average (kg/day) |
GPC (kg/student/day) |
GPC Kg/Average/day |
Average generation Kg/day |
|
School 6063 - Juan Velazco Alvarado |
802 |
310 |
0,386 |
0,3522 |
228 |
|
Autonomous University of Peru |
560 |
225 |
0,401 |
||
|
I.E.N. 6063 Jose Carlos Mariátegui |
1120 |
325 |
0,291 |
||
|
I.E.6669 -Pachacutec |
940 |
295 |
0,313 |
||
|
Nursery nest |
43 |
16 |
0,37 |
||
Creation of beach recreation centers
The Plaza recreation center was taken as a representative sample. As it is currently the cold season, recreation centers do not represent highly accurate figures at this time. In summer, the results at these recreation centers tend to be different.
|
Table 13. Solid waste generation in recreational centers |
|||
|
Recreational Centers |
Assistants per day/ Number |
Generation per Establishment – GPE (kg/est/day) |
GPC/Media |
|
Club La Plaza Recreation Center |
25 |
10kg |
0,25Kg/day |
Local Government Generation
In terms of local government, two entities were sampled, namely a specific area of the municipality of Villa El Salvador (logistics) and the main police station of the district, obtaining a per capita average of 4,5 kg/day.
|
Table 14. Solid waste generation by local governments |
|||
|
Local Governments |
Total Workers |
GPC (kg/work/day) |
Gen/Average |
|
Municipality of V.E.S. Logistics area |
13 |
5,3kg |
4,5kg |
|
PNP Commissioner |
10 |
3,7kg |
|
Generation of waste in convents and monasteries
Convents are not places that generate a lot of waste or solid waste. The Immaculate Conception parish on Bolívar Avenue was sampled, with the following results:
|
Table 15. Solid waste generation in temples, convents, and monasteries |
|||
|
Temple, Convents, or Monasteries |
Assistants per day/ Number |
Gen/Daily |
GPC (kg/Assist /day) |
|
Immaculate Conception Parish |
95 |
16kg |
0,168kg |
Generation of Free Assistance
The sample by usage does not yield a representative sample for this item. The result is as follows:
|
Table 16. Solid waste generation from free assistance |
|||
|
Free Assistance |
Total Number of Workers |
Gen/Daily |
GPC (kg/work/day) |
|
Free Legal Assistance Centers - ALEGRA |
4 |
1,5 kg |
0,375 |
Generation of undeveloped land
There are no average generation records for this type of use. Only three locations were sampled, one of which is considered a small dump, and no solid waste was found at the other two locations.
|
Table 17. Solid waste generation from undeveloped land |
||
|
Undeveloped Land |
Location |
Gen/average |
|
Wastelands |
Various areas of V.E.S. |
10 kg/day |
Generation Production workshops (industrial park)
The results of production workshops in the district were as follows:
|
Table 18. Solid waste generation from production workshops |
||||
|
Production Workshops |
Total Number of Workers |
Gen/daily |
GPC (kg/work/day) |
Gen/Average |
|
Project and decorations EL NAZARENO |
25 |
30 kg/day |
1,2kg/day |
2kg/day |
|
Fadima Group EIRL |
10 |
28Kg/day |
2,8kg/day |
|
Generation of Non-Domestic Solid Waste – Villa El Salvador 2017
Total solid waste generation in the district of Villa El Salvador
The total solid waste generation in the district of Ate has been obtained by adding up the generation from each source; the following table shows the results.
|
Table 19. Solid waste generation in the district of Villa El Salvador |
||||
|
|
Description by Use |
Properties X Use |
Generation /property/day/ kg |
Generation/ property/day/Ton |
|
1 |
Commerce |
14 448 |
2,117 |
30,6 |
|
2 |
Market |
56 |
477,19 |
76,827 |
|
3 |
Industry |
1503 |
18,75 |
28,181 |
|
4 |
Healthcare Facility |
52 |
54,33 |
0,760 |
|
5 |
Public Service Entity |
330 |
0,58 |
0,47 |
|
6 |
Educational Center |
145 |
228 |
33,06 |
|
7 |
Beach Recreation Center |
119 |
10 |
1,19 |
|
8 |
Local Government |
40 |
4,5 |
0,18 |
|
9 |
Temple, Convent, and Monastery |
73 |
16 |
0,11 |
|
10 |
Free Assistance |
2 |
1,5 |
0,03 |
|
11 |
Mothers' Club and Soup Kitchen |
3 |
50 |
0,15 |
|
12 |
Production Workshop (5 people) |
185 |
28 |
5,18 |
|
|
|
16 880 |
|
176,71 |
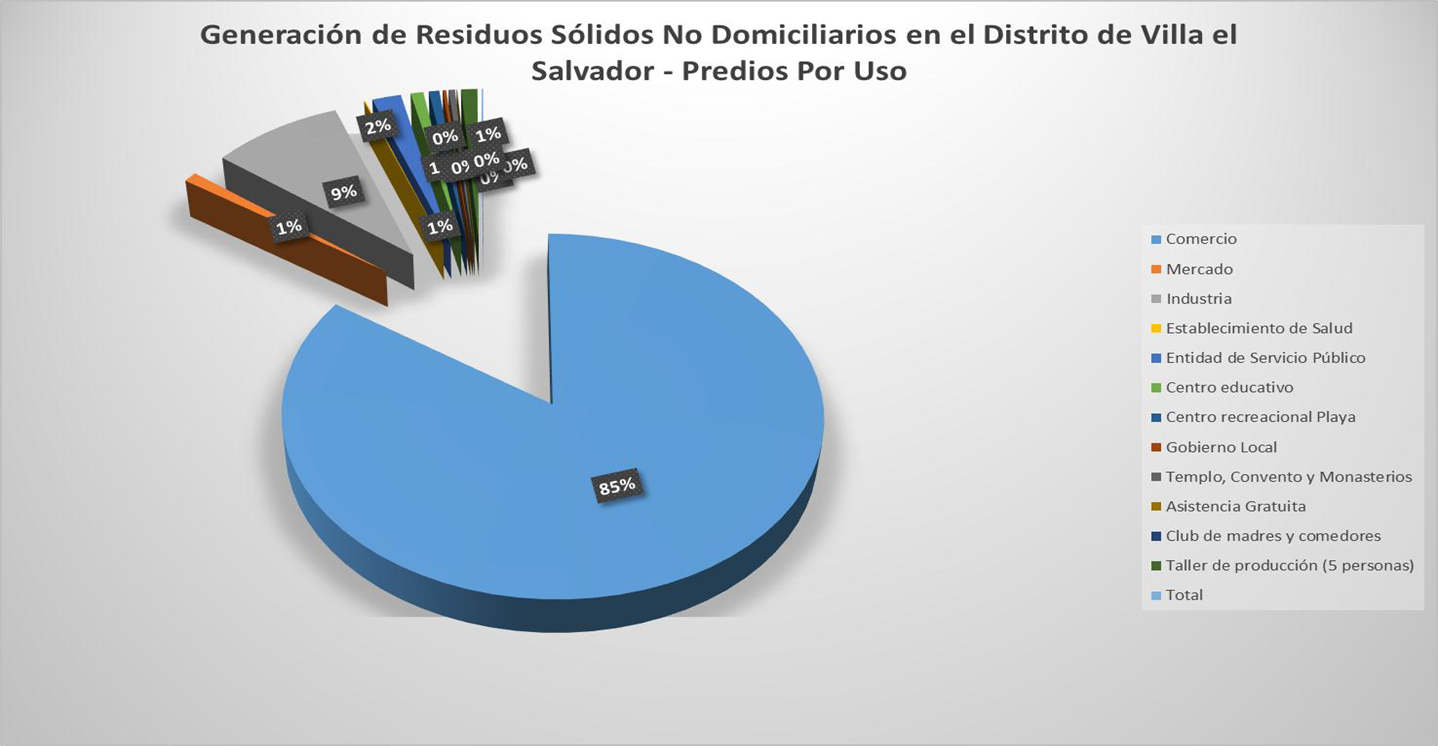
Figure 58. Generation of non-domestic solid waste in Villa El Salvador
Projection of total non-domestic solid waste generation in the district of Villa El Salvador in 2017
To obtain the projection for non-domestic solid waste, we will use the population growth rate for Villa El Salvador (4,15 % per year) obtained from the INEI, as this data allows us to obtain an approximation of how the population will grow in the coming years.
|
Table 20. Projected non-domestic solid waste generation |
||
|
Year |
Solid waste generation non-domestic (tons/day) |
Non-domestic solid waste generation (tons/year) |
|
2018 |
176,71 |
64 499,15 |
|
2019 |
184,04 |
67 174,6 |
|
2020 |
191,67 |
69 959,55 |
|
2021 |
199,62 |
72 861,13 |
|
2022 |
207,90 |
75 883,5 |
|
2023 |
216,52 |
79 029,8 |
|
2024 |
225,50 |
82 307,5 |
The population growth rate (4,15 % per year) was used to estimate the increase in non-domestic solid waste generation. INEI 2007 Census.
Density of non-domestic solid waste Density of solid waste from commercial establishments
The estimate of the density of solid waste from commercial sources resulted in a loose density of 136,52 kg/m3, which when compacted gives a result of 158,95 kg/m3, finally showing a final compaction degree of 1,164, as shown in the density table.
|
Table 21. Solid waste density |
|
|
Average loose density (kg/m3) |
136,52 |
|
Average compacted density (kg/m3) |
158,95 |
|
Solid waste compaction rate |
1,164 |
Physical composition of non-domestic solid waste
The physical composition of solid waste in the district of Villa el Salvador, as in the physical composition of household waste, was analyzed, which determined the presence of recyclables at 26,49 % and compostable solid waste at 79,89 %, while 20,11 % corresponded to non-reusable solid waste.
|
Table 22. Physical composition of non-domestic solid waste |
|
|
Type of solid waste |
% Composition |
|
1. Reusable waste |
79,89 |
|
1.1 Food waste (food scraps, fruit) |
53,40 |
|
1.2.1. Paper |
4,57 |
|
White |
2,16 |
|
Newspaper |
2,12 |
|
Mixed |
0,29 |
|
1.2.2. Cardboard |
2,52 |
|
White |
1,84 |
|
Mixed |
0,68 |
|
1.2.3. Glass |
|
|
1.2.4. Plastic |
7,05 |
|
PET (1) (soda bottles) |
2,13 |
|
HDPE (2) (yogurt bottles, |
2,73 |
|
LDPE (4) (cups, disposable plates, film) |
1,19 |
|
1.2.5. Tetra pack |
|
|
1.2.6. Metals |
2,47 |
|
Tin (tinplate) |
1,56 |
|
Copper (cables) |
0,42 |
|
Aluminum |
0,12 |
|
Other metals |
0,37 |
|
1.2.7 Electronic waste |
0,13 |
|
Cell phones |
0,13 |
|
1.2.8. Other reusable materials |
3,76 |
|
Textiles (fabrics) |
3,25 |
|
Other |
0,51 |
|
2. Non-recyclable waste |
20,11 |
|
Plastic bags |
2,65 |
|
Candy wrappers, metallic plastic |
1,58 |
|
Toilet paper |
2,14 |
|
Diapers |
4,38 |
|
Batteries |
3,75 |
|
Other |
2,20 |
|
|
3,41 |
|
Total |
100 |
DISCUSSION
The inclusion of formalized waste sorters in the economic aspect of municipal management is positive, although not to a very high degree, due to the following reasons:
· There is an updated record of the amount of recoverable waste collected by waste sorters, which is not collected or transported by the municipality.
· The municipality saves on solid waste management costs. From November 2014 to September 2017, 563 tons of solid waste were not disposed of in landfills. This means less spending on collection and disposal services, and the municipality reports increasing savings, which in four years amount to S/ 35 554,83.
|
Table 23. Municipal Green Bond Program |
||||
|
Year |
Properties served by ¨El Bono Verde¨ |
Green Bonus Collection on properties (tons/month) |
Cost reduction |
Coverage of the "Green Bond” |
|
2014 |
9562 |
13 |
1378,00 |
8,00 % |
|
2015 |
13 400 |
15 |
9720,00 |
20,00 % |
|
2016 |
17 887 |
17 |
11 628,00 |
26,00 % |
|
2017 |
11 309 |
19,95 |
12 828,84 |
16,87 % |
Neighbors in the "Green Bonus" program receive ongoing training and separate and store their recyclable waste to deliver it to waste sorters. Seventy-two percent of neighbors consider the work performed by waste sorters to be a job like any other and that it is very important because it contributes positively to the cleanliness of the district. Some neighborhoods are not fully involved in this program.(15,16,17)
Based on the statistical analysis of Fisher's test, it was determined that there are significant differences in residents' perceptions of the different formalized waste-sorting associations in the district of Villa El Salvador.(18,19,20)
Applying Duncan's test, it can be seen in detail that there are significant differences:
|
Table 24. Results of Duncan's test (Villa el Salvador District) |
||
|
Associations serving Urban developments – Villa el Salvador |
Average |
Significance* |
|
Las Aguilas (LAG) |
30 152 |
a |
|
Virgen del Carmen (VDC) |
28 141 |
ab |
|
Asociacion los tigres (ALT) |
27 148 |
b |
|
Siempre Floreciendo (SFL) |
26 750 |
b |
|
Sector Florece (SF) |
22 622 |
c |
|
Ecored (ECO) |
17 345 |
c |
|
Note: * Same letters, no significance Duncan p=0,05. |
||
Table 24 shows the percentage value urban developments lack to achieve the ideal profile of a citizen who belongs to a selective collection program. From this, we can conclude that the residents served by the Las Águilas association are the closest to the profile, and those served by the Ecored association are the furthest away. All of this is aimed at improving the fair collection of municipal taxes on solid waste and, therefore, improving residents' quality of life.(21,22)
Component 1
Quantify the daily per capita generation of solid waste by the inhabitants of the district of Villa El Salvador.
Expected results
Conduct a solid waste characterization study every two years in the district.
Activities
The proposed activities are:
· Develop a work plan for the study.
· Conduct the necessary fieldwork (surveyors, recyclers, etc.).
· Present the final report to the mayor and municipal manager.
Component 2
Identify all types of solid waste generated by the inhabitants of the district of Villa el Salvador.
Expected results
Conduct a physical analysis of solid waste generation in the district by collecting a representative waste sample for seven days.
Activities
· Separate the sample by socioeconomic level.
· Collection of the representative sample of waste for seven consecutive days.
· Analysis of the collected solid waste by a group of recyclers.
· Prepare a detailed physical report on all the solid waste collected.
Component 3
Sort all municipal licenses by actual use and their respective types of businesses in the district of Villa el Salvador.
Expected results
Conduct a study to characterize household and non-household solid waste to identify the various business uses associated with municipal licenses.
Activities
· Identification of the various uses or categories of collection (schools, hospitals, markets, and multiple businesses).
· Five training sessions will be held for surveyors and recyclers to enable them to identify the respective uses of licenses while carrying out their solid waste characterization work in the district.
Component 4
Organize the fair collection of municipal taxes to improve residents' quality of life in the Villa El Salvador district.
Expected results
Sorters trained in comprehensive solid waste management. Population actively participating in the selective collection program.
Activities
· Formalized sorters carried out a door-to-door awareness campaign.
· The municipality will issue an ordinance promoting the inclusion of formalized waste sorters and providing incentives for residents who participate in the "Green Bonus" program.
· Delivery of discount tickets of up to 50 % on municipal tax payments to residents who join the "Green Bonus" recycling program.
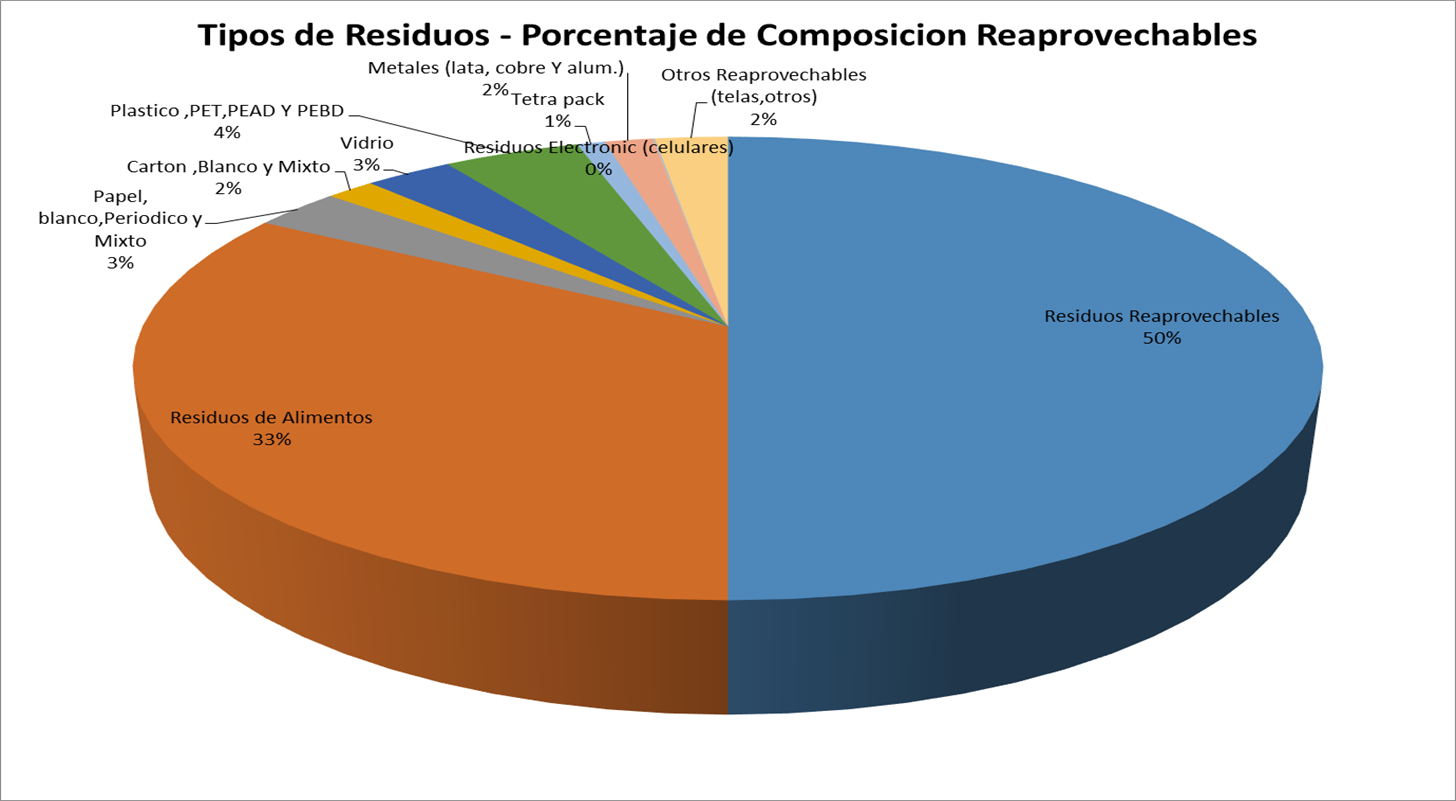
Figure 59. Types of waste – Reusable composition
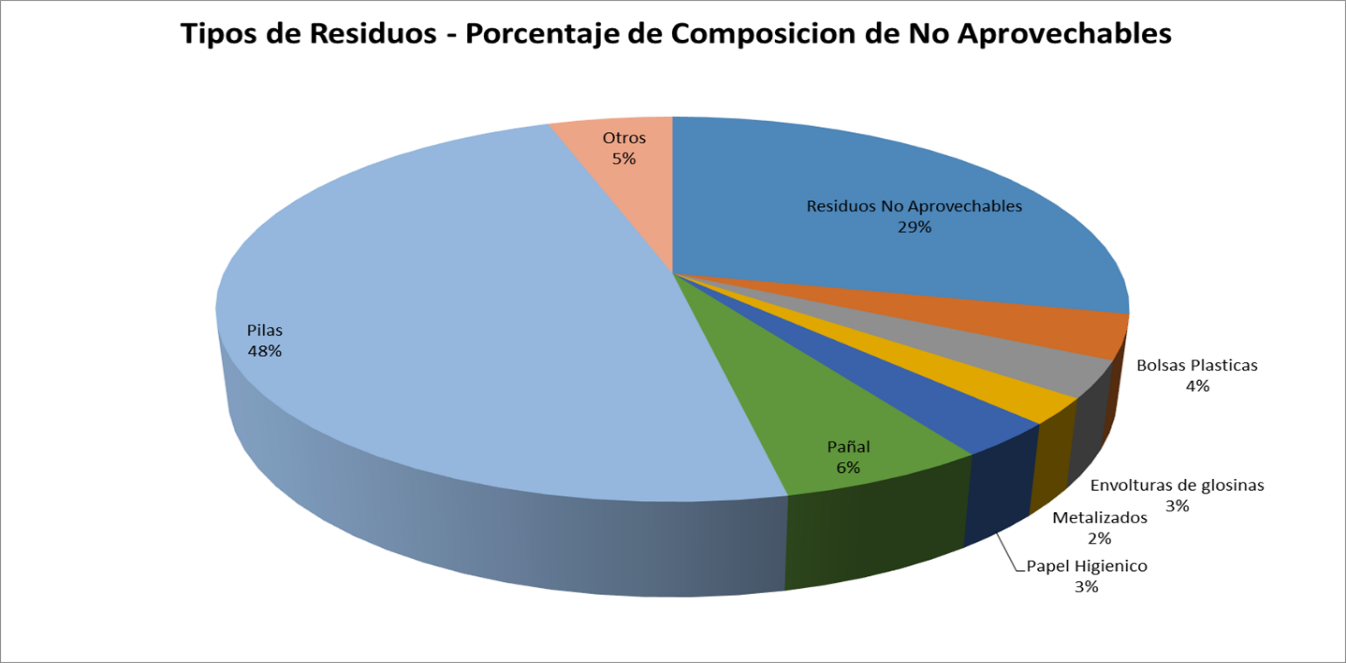
Figure 60. Types of waste – Non-reusable composition
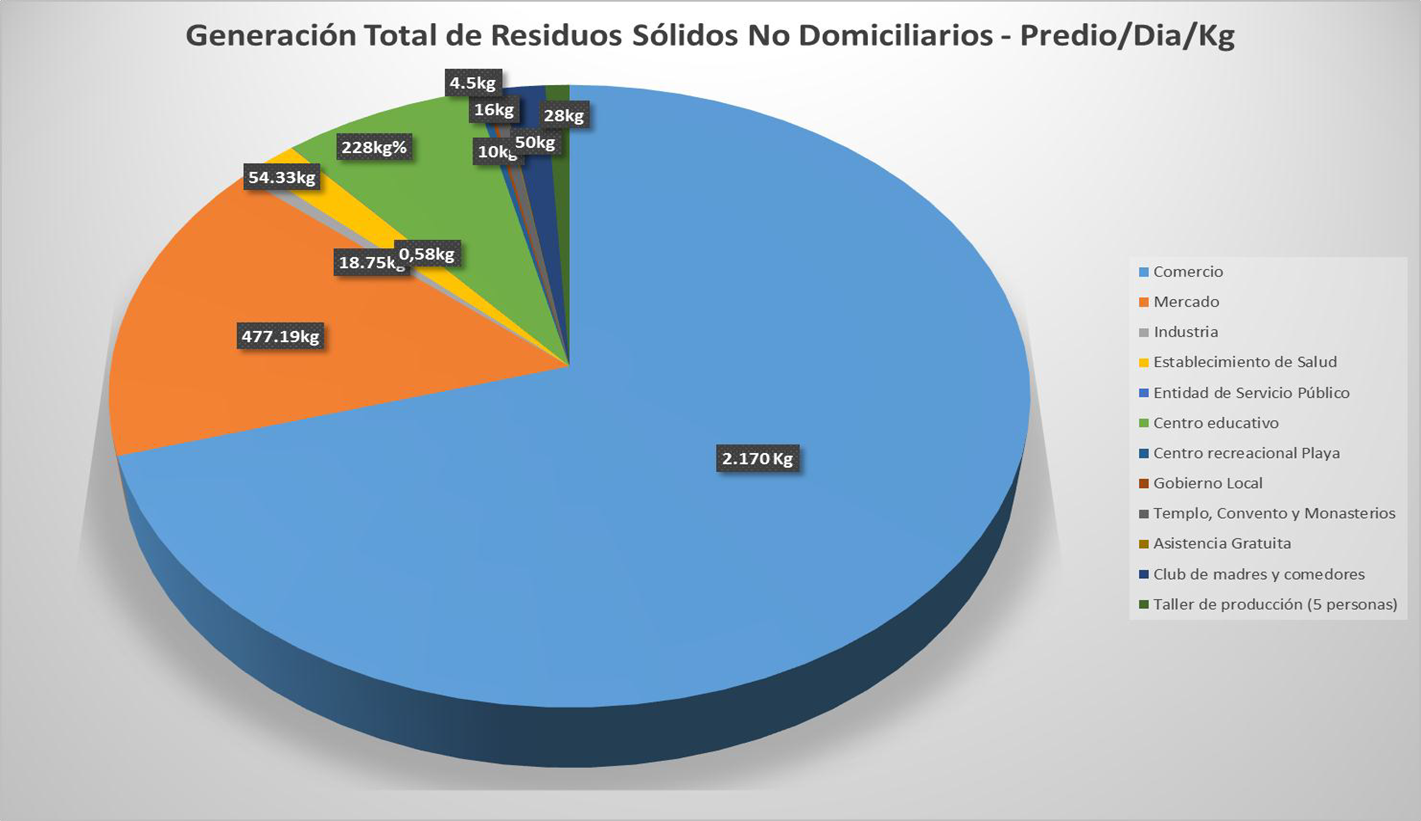
Figure 61. Total generation of household solid waste
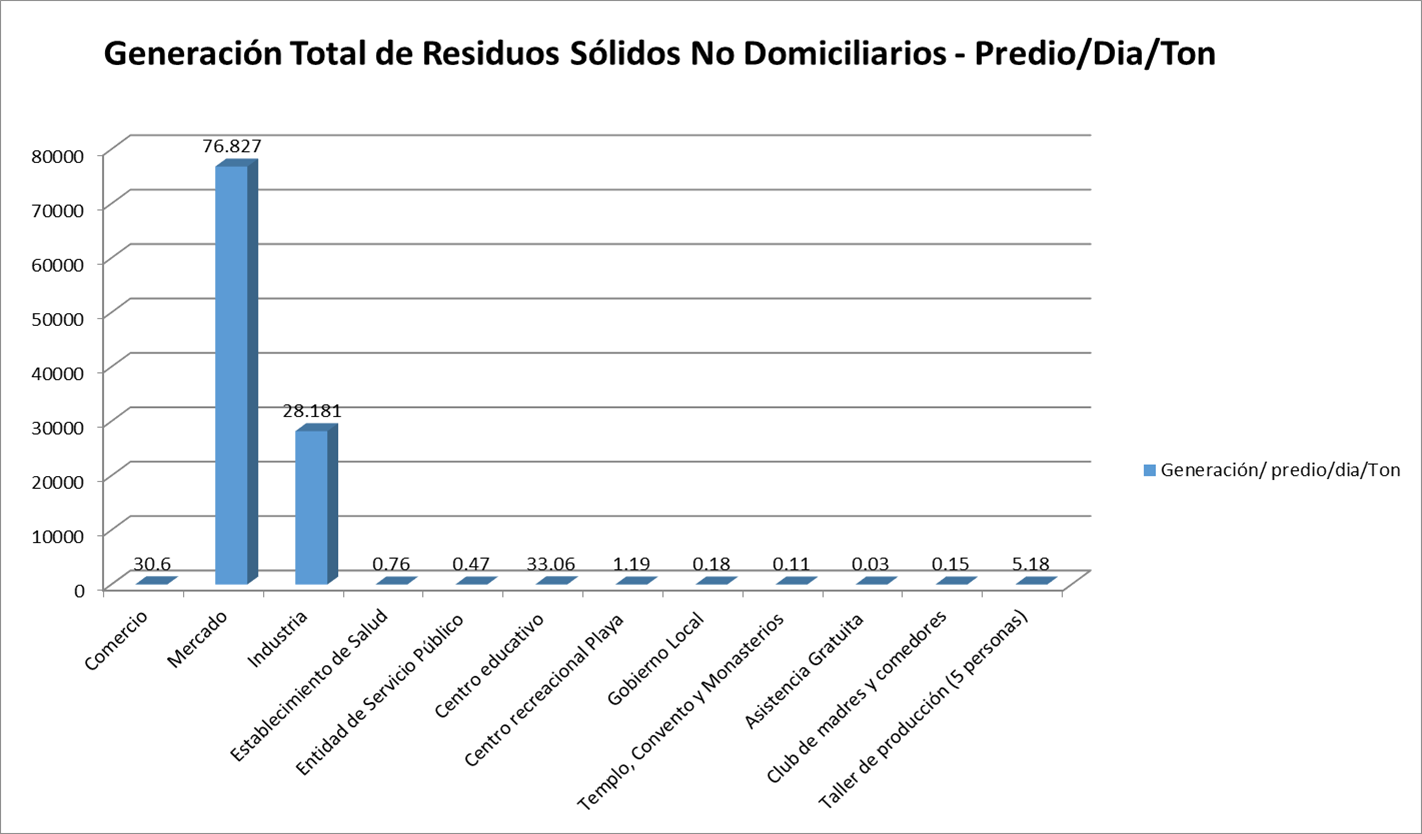
Figure 62. Total generation of non-domestic MSW per property/day/ton
CONCLUSIONS
1. The daily per capita generation of waste by residents of the Villa El Salvador district (0,632 kg/day) has been determined using various tools employed by the group conducting the study, which included both qualitative and quantitative methods. The study was supported by the Ministry of the Environment and the municipality of Villa El Salvador.
2. Through our study of the characterization of household solid waste, we have identified all types of household solid waste through daily collection over seven days from a representative sample of the three socioeconomic levels, with the support of our recyclers hired for this purpose, which is detailed in Table 18, Physical composition of household solid waste in the district of Villa El Salvador.
3. There are many uses for household and non-household solid waste. This does not allow for a precise classification of the different municipal licenses issued for various items, so residents use a specific license to do other things. This study has allowed us to identify these issues and, as a result, achieve substantial savings for the municipality of Villa El Salvador. The results indicate that non-domestic waste is produced at 153,13 tons/day.
4. There is a reasonably strong trend toward a change in awareness of the problem of solid waste emissions in the district. This is confirmed by our survey, which identifies recycling as a key factor in improving residents' quality of life. The solid waste generation forecast for the next six years highlights the need to develop a better waste management system involving new technology and greater investment of resources, which will be subject to an increase in tax collection.
BIBLIOGRAPHIC REFERENCES
1. Aguilar M, Salas H. La basura: manual para el reciclaje urbano. México: Editorial Trillas; 1999.
2. Andre F, Cerda E. Gestión de residuos sólidos urbanos: análisis económico y políticas públicas. Cuad Econ ICE. 2006;(71):71-91.
3. Alegre M. Guía para el manejo de residuos sólidos en ciudades pequeñas y zonas rurales. Lima: CEPIS/OPS/OMS; 1998.
4. Baccini C. Regional material management. Zúrich: Swiss Federal Institute for Water Resources and Water Pollution Control, Universidad de Tecnología de Zúrich; 1999.
5. Benvenuto O, Benvenuto E. Los gobiernos municipales ante la falta de tratamiento de los residuos sólidos: la externalización de los costos y sus consecuencias ambientales. Rev Inst Int Costos. 2008;3:51-67.
6. Bilitewski B, Hardtle G. Introducción a la gestión de residuos orgánicos. Berlín: Springer; 1999.
7. Banner E. Compostaje de los residuos orgánicos. Viena: Universidad Agraria de Viena, Instituto de Residuos Sólidos; 2008.
8. Braun R. Biogás: fermentación anaerobia de residuos orgánicos. Viena: Springer; 1992.
9. Bustos C. La problemática de los desechos sólidos. Econ. 2009;27:121-44.
10. Costa. Aspectos técnicos del servicio de aseo: estación de transferencia. Manual de instrucción. Lima: OPS/EHP/CEPIS; 2002.
11. Bocanegra C. Impactos e indicadores ambientales en la ciudad de Trujillo. Trujillo: Edit. Nuevo Norte S.A.; 2000.
12. CONAM. Guía metodológica para la formulación de planes integrales de gestión ambiental de residuos sólidos (PIGARS). Lima: CONAM; 2001.
13. CONAM, CEPIS, OPS. Guía técnica para la clausura y conversión de botaderos de residuos sólidos. Lima: CONAM/CEPIS/OPS; 2004.
14. DIGESA, JICA. Gestión de residuos peligrosos en el Perú. Manual de difusión técnica N°1. Lima: Dirección de Ecología y Protección del Ambiente de Salud; 2006.
15. Gómez R, Flores F. Ciudades sostenibles y gestión de residuos sólidos: agenda 2014, propuestas para mejorar la descentralización. Lima: Universidad del Pacífico, Centro de Investigación; 2014.
16. Kazmier L. Estadística aplicada a la administración y la economía. México: McGraw-Hill; 1999.
17. Kinnear T. Investigación de mercados. Bogotá: McGraw-Hill; 1998.
18. Jaramillo J. Guía para el diseño, construcción y operación de rellenos sanitarios manuales. 1999.
19. Rittmann B, McCarty P. Biotecnología del medio ambiente: principios y aplicaciones. 1.ª ed. México: McGraw-Hill; 2001.
20. Sawyer C, McCarty P, Parkin G. Química para ingeniería ambiental. 4.ª ed. México: McGraw-Hill; 2007.
21. Tchobanoglous G. Gestión integral de residuos sólidos. México: McGraw-Hill; 1993.
22. Villena J. Guía para el manejo interno de residuos sólidos. 1994. Dervitsiotis KN. Operations management. New York: McGraw-Hill; s.f.
FINANCING
None.
CONFLICT OF INTEREST
The authors declare that there is no conflict of interest.
AUTHORSHIP CONTRIBUTION
Conceptualization: Miguel Ángel Melgarejo Quijandria.
Data curation: Miguel Ángel Melgarejo Quijandria.
Formal analysis: Miguel Ángel Melgarejo Quijandria.
Research: Miguel Ángel Melgarejo Quijandria.
Methodology: Miguel Ángel Melgarejo Quijandria.
Project management: Miguel Ángel Melgarejo Quijandria.
Resources: Miguel Ángel Melgarejo Quijandria.
Software: Miguel Ángel Melgarejo Quijandria.
Supervision: Miguel Ángel Melgarejo Quijandria.
Validation: Miguel Ángel Melgarejo Quijandria.
Visualization: Miguel Ángel Melgarejo Quijandria.
Writing – original draft: Miguel Ángel Melgarejo Quijandria.
Writing – review and editing: Miguel Ángel Melgarejo Quijandria.